On Monday 27th July 2020 I posted the article ‘Extrapolating from the trend of ‘Aggregated Raw Off-Target’ results, to yield some clues to what the future might hold … and one challenge for NEM 2.0’ to follow on from ‘Striving to understand the underlying challenges with Semi-Scheduled generators (re AER Issues Paper)’, published a week earlier.
This short article is the first of many that will follow (time permitting) looking at each of the 98 dispatch intervals identified as seeing Aggregate Raw Off-Target (i.e. ‘Agg ROT’) for all Semi-Scheduled units:
1) either >300MW (i.e. collective under-production across all Semi-Scheduled units at the time); or
2) the more rare* instances of Agg ROT <-300MW (i.e. collective over-production across all Semi-Scheduled units at the time).
* we’ve already noted that this accounted for only 5 instances of collective over-production compared to 93 instances of collective under-production over >10 years through until 31st December 2019 (i.e. 98 dispatch intervals in total, most of which occurred in 2019).
Many of these case studies will be brief.
My aim is to put these together and work my way through all 98 dispatch intervals, before circling back to summarise what we find in terms of any patterns leading to these extreme cases in Aggregate Raw Off-Target. Given the number (and our need to focus firstly on direct needs of existing and new clients) it’s likely this will take some time. In releasing these case studies progressively, they might be able to be considered in the AER’s deliberations, and probable deliberations at the AEMC (and ESB) to come as well.
———————————-
(A) Summary results for Thursday 4th July 2013 at 14:55
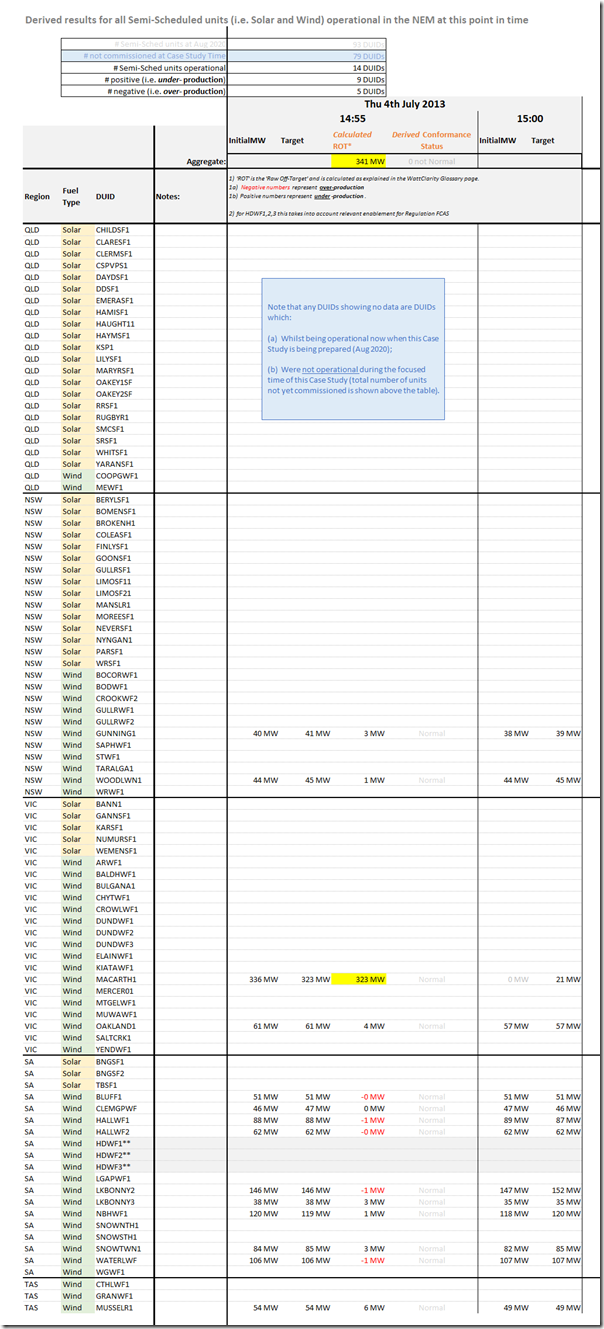
Understanding what happened in this particular dispatch interval is a fairly simple matter that is highlighted in the following table that summarises both the aggregate and individual Raw Off-Target performance of all Semi-Scheduled units that were operational at the time:
As noted at the top of the table, there were only 14 DUIDs operating at the time (compared to 93 DUIDs today).
1) Of these 9 units were under-performing whilst 5 units were over-performing in this dispatch interval (i.e. almost twice the number under-performing).
2) All but one of these units showed small deviations from Target.
(B) Unit trip at Macarthur Wind Farm swamps aggregate result
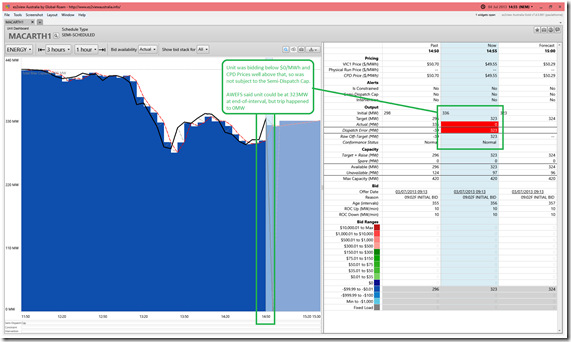
It’s plain to see that the reason why this dispatch interval was flagged in our top-down search for extremes in results was because of what looks like a trip of Macarthur Wind Farm in western Victoria.
This is how that particular interval looked in the current ‘Unit Dashboard’ widget in ez2view, wound back 7 years ago through the powerful ‘Time Travel’ functionality:
Some readers would be wise to remember how Hugh Saddler noted how power station trips are normal (but blackouts are not)! Hence I’m not bothering to look further on this one…


Leave a comment