With the 6 case studies preceding this one, we’ve covered all the instances through 2013, 2014, 2015 where Aggregate Raw Off-Target across all Semi-Scheduled units was in excess of 300MW (in either direction), and we’ve already also covered this case of collective under-performance on Tuesday 5th April 2016.
We’re incrementally exploring these specific extreme events following from a bit of a prompt by the AER Issues Paper (which is a bit more narrowly focused), but moreso inspired by the deliberations by the (now defunct) COAG Energy Council and (under threat?) ESB relating to ‘NEM 2.0’.
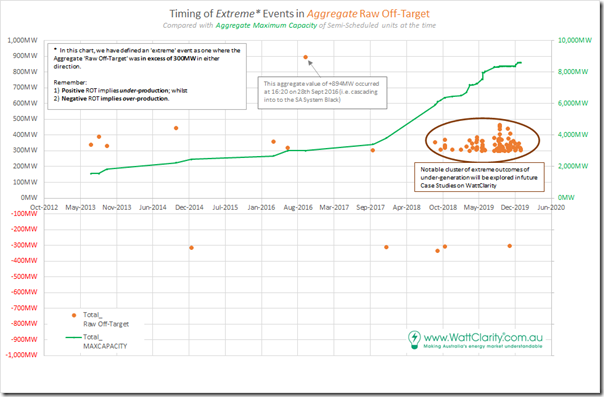
There were 98 distinct dispatch intervals between 2013 and 2019 where the Aggregate Raw Off-Target was at those extreme levels:
1) With most of these (95) being under-performance, and only a small number (5) being over-performance (including this one on 8th Jan 2015).
2) With the majority of the cases being in late 2018 and through 2019.
We’re starting at the start, in order to gain a clearer sense of the progression of these extremes and to see if there are other factors that come into play as the installed capacity of Semi-Scheduled plant ramps up rapidly in recent times. The following chart was published here on 27th July 2020 showing the progression of the extremes:
When we’ve worked our way through the remaining dispatch intervals, we’ll return with a different style of article to summarise up. Hopefully this will be in time for AEMC consideration of whatever comes out of the AER Issues Paper (and, perhaps more importantly, broader consideration in relation to NEM 2.0.
———————–
This case study picks another of the many cases of collective under–performance.
(A) Summary results for Thursday 23rd June 2016
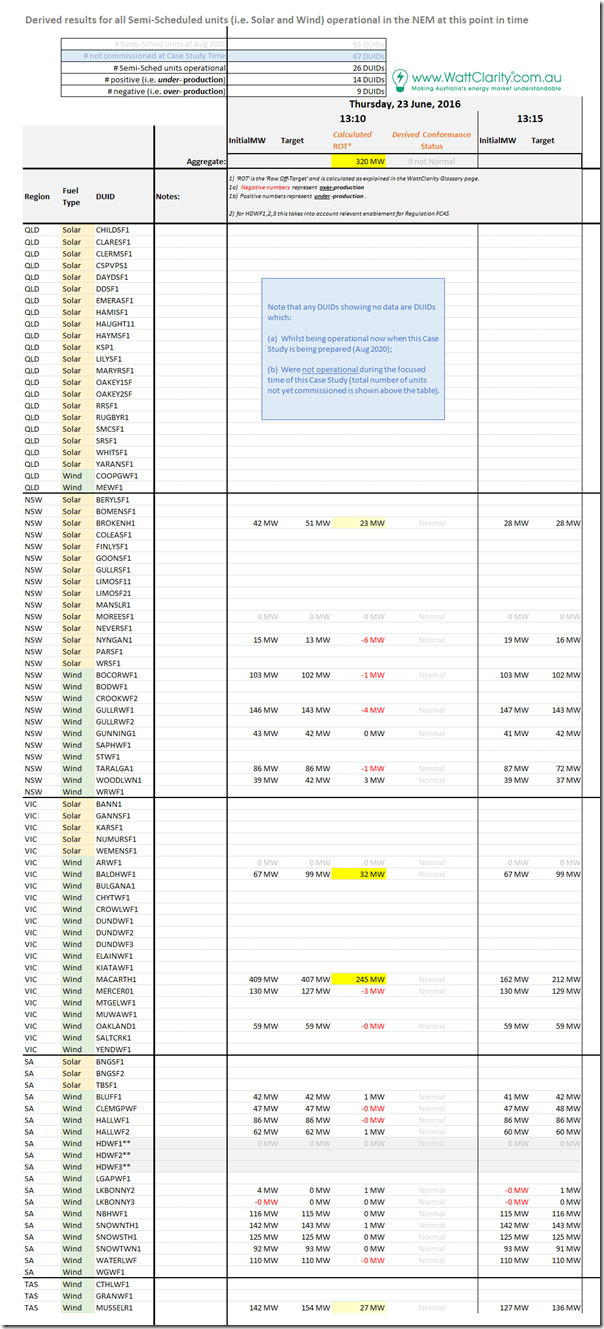
Again, we start with this summary table, highlighting the individual Raw Off-Target performance of all Semi-Scheduled units that were operational at the time:
There’s a few things that can be highlighted here:
1) This period sees 26 DUIDs registered in total at this point in time:
(a) Three of these are Solar Farms;
(b) So the remaining 23 are Wind Farms.
2) Across all of the DUIDs:
(a) Three played no role (probably not operational)
(b) 14 DUIDs were under-producing, whilst 9 DUIDs were over-producing (i.e. more under-producing, which seems to be a common theme).
(c) Of the 14 DUIDs under producing, 4 DUIDs (spread across 3 regions) flagged as significantly so…
(B) Looking at some specific DUIDs
… and so we will explore each of these below, working top-to-bottom on the table.
Again we can show this specific dispatch interval clearly with the ‘Unit Dashboard’ widget in ez2view, wound back 4 years ago through the powerful ‘Time Travel’ functionality:
(B1) Broken Hill Solar Farm in NSW
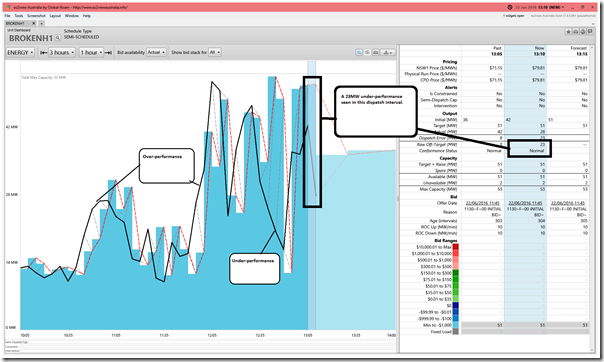
This is the first case study in this series featuring a significant Raw Off-Target from a solar farm:
As we can see in this snapshot, the performance of BROKENH1 from a Raw Off-Target perspective had been ‘all over the shop’ in the prior 3 hour period:
1) A number of instances of significant under-performance; and
2) Also a number of instances of significant over-performance.
Perhaps some cloud-cover related challenges?
(B2) Bald Hills Wind Farm in VIC
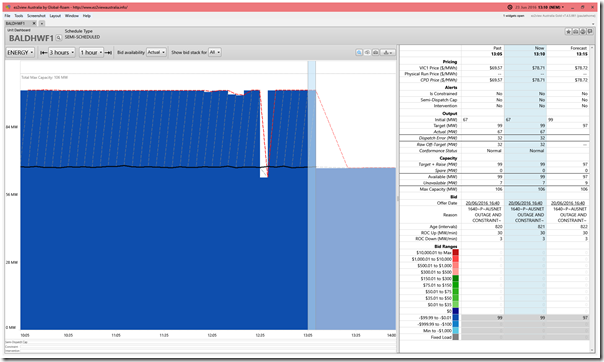
Moving into VIC, BALDHWF1 shows a situation we’ve seen before in some of these other case studies:
We see that the AWEFS system seems to keep setting the energy-constrained Availability up at 99MW and then (hence because of where the volume is bid) dispatching the whole amount. Yet the output is stuck around 67MW.
This would have meant a significant Raw Off-Target deviation for all but 1 dispatch intervals in the past 3 hours. Can any reader help explain what might have been happening here, please?
(B3) Macarthur Wind Farm in VIC
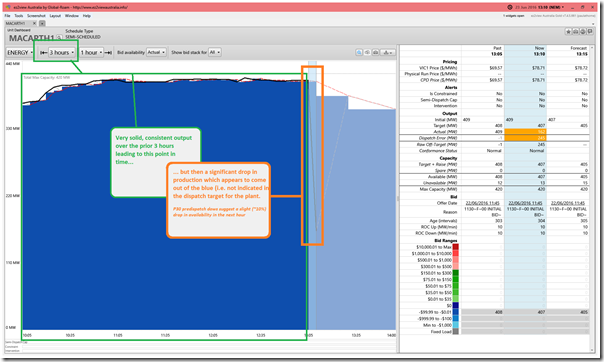
Clearly the largest contributor is the Macarthur Wind Farm in western VIC, which under-performs in this dispatch interval by 245MW:
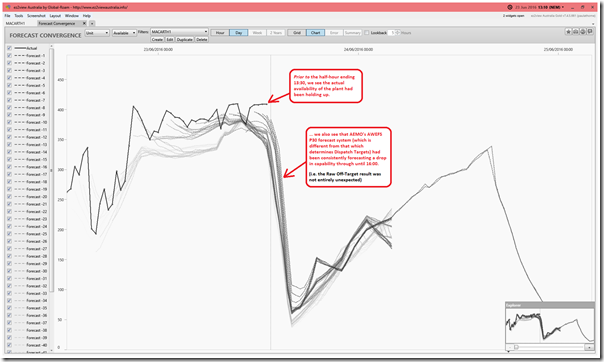
As noted on the image above, we see that the AEMO’s P30 predispatch forecasts were showing that the forecast availability of the plant would drop by around 10% for the half-hour Trading Period ending 14:00. Out of curiosity, I opened up the ‘Forecast Convergence’ widget focused on the same dispatch interval (i.e. 13:10) when the surprise drop in output happen, and we see a lot more context here:
My understanding of how AWEFS works is improving over time (thanks for a bit of patient tutoring by Marcelle and others). Any mistakes I still make are wholly mine, though!
1) So my current understanding is that there are two separate mechanisms that work a bit separately – that which produces Availability (hence Targets) in a dispatch interval timeframe, and that which produces the P30 predispatch forecasts for Availability (which is what is shown in this Forecast Convergence view).
2) It’s clear that AEMO in their AWEFS P30 forecasts was anticipating a large and sharp drop in energy-constrained availability at the plant, probably due to a drop in wind speed.
3) It’s the timing of this change that did not make it into the dispatch target for the 13:10 dispatch interval – which I understand:
(a) Is due in part to the separate mechanism used for Availability in the Dispatch Interval; but
(b) Also due to the fundamentally challenging nature of ascertaining exactly when such things as this might take effect, especially considering these forecasts are being generated >5 minutes in advance of the time of delivery.
(B4) Musselroe Wind Farm in TAS
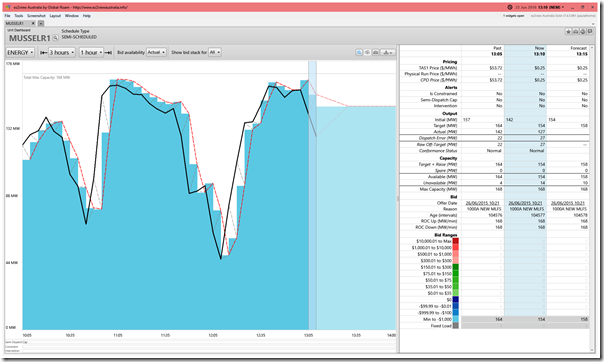
Moving into Tassie we see MUSSELR1 showing this performance:
It looks here like the wind had been up-and-down a couple times in the prior 3 hour period, with the Dispatch Targets lagging what was actually happening on the plant (in part because of the use of ‘persistence’ as one of the inputs into the forecast process in this timeframe).
(C) Reminder!
That’s 7 Case Studies completed now, and it might be timely to remind readers that it is the collective performance of the suite of Semi-Scheduled plant which is of most interest to me – and, in particular, the extent to which the growth in installed capacity will ensure that we’ll see an increasing incidence of large Aggregate Raw Off-Target results in the years ahead. If so, there will be costs to managing this, moving forwards – particularly as the current fleet of dispatchable plant retires.
Please keep this in mind when reviewing the above, and future case studies…


Leave a comment