Friday 31st January 2020 was a remarkable day in so many different ways (including, most likely, other ways that I am not yet aware of). Following from Friday evening’s simple article, I’ve invested as much spare time* as I’ve been able to over the weekend in order to pull apart some of the pieces of the puzzle.
* note – spare time a little eaten into by what happened in the NSW region on Saturday with another ‘LOR2 out of the blue’!
Just like an onion that thing has developed threads spreading out in some many different directions, so I have given up on the idea of posting thoughts as a single article (which would have ended up infinitely long, and never arrived) and instead decided to parcel this up in more digestible chunks and publish progressively in the days (probably weeks) ahead.
Today I thought I’d start with a few headline questions, and observations, to help lay out the framework I am trying to work within.
(A) Do you know of others who can help us?
As noted before, there’s two big reasons why we engage in forensic analysis like what we’re doing with respect to this event (including utilising external resources and data sources wherever we can). We continue to be on the lookout of others who can help us to do this… better.
Do you know of people who can help us?
(B) The level of risk in the NEM is increasing
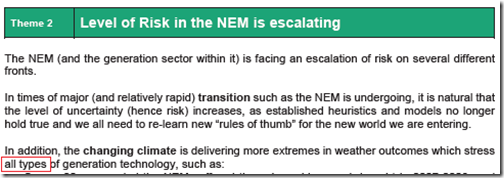
Getting this one out of the way first, the events of this week seek to reinforce some of the observations explored in our mammoth Generator Report Card 2018 – which we released on 31st May 2019 – the statics component we have updated and extended and only just released last week through a Generator Statistical Digest 2019.
This was Theme 2 within Part 2 of the 180-page analytical component. One particular area of increasing risk is in relation to the many different dimensions through which “weather” affects our electricity supply and consumption process:
We explored that in Theme 6 within Part 2 of the GRC2018. This summer has certainly seen its own fair share of weather-related events, that could certainly not be called ‘boring’.
(C) Demand levels not seen for 11 years, or maybe longer
On Friday evening I noted that one of the main take-outs from Friday’s events was that the levels of Scheduled Demand seen in the NEM were the highest in 11 years – and that this was in spite of both:
1) All of these factors contributing to declining demand in the interim period; and
2) A significant volume of energy that would otherwise have been served on Friday being unserved, for a range of reasons.
This naturally brings to mind the ‘1 in 10 year forecasts’ that the AEMO uses in so many planning documents – and also brings reflections on the (rare) coincident hot weather in both NSW (particularly the demand zone of Sydney-Newcastle-Wollongong) and VIC (particularly Melbourne-Geelong).
Indeed, I wondered how levels of ‘Native Consumption’ might have compared – given all the complexities in actually measuring demand. I did not some scepticism, however (such as here) – and will look forward to exploring more as time permits.
(D) Extreme winds down transmission towers – again – in southern Australia
Without venturing down the rabbit hole of the detailed sequence of events in the South Australian grid at the time of the SA System Black it’s worth noting that this event is the second time that easily jumps to mind that transmission towers have been buckled in the south-eastern part of the NEM.
Furthermore, I do believe that this might be the first time an element of the 500kV grid has been directly affected (though some more learned reader might correct me on this?)
(D1) What is the actual failure rate of transmission towers
Its understandable that others will do what I immediately did on hearing that element of Friday’s developments – as in thinking that ‘that’s unusual!’, with this unquestioned supposition (which is not based on real data, but rather on my limited and selective memory) then feeding into thoughts about what might
However I understand that the data actually suggests otherwise (i.e. that failures might be more common than we automatically think), and will look forward to being able to publish something based on the data in the coming days and weeks…
(D2) Transmission tower design standards
It’s also natural that people will ask questions about the design standards being used to construct transmission towers – and specifically ask whether they need to be upgraded into the future. Some of these questions will relate to the extent to which wind/weather patterns:
(a) Are different in southern Australia from northern Australia; but also
(b) The extent to which any forecast shift in weather patterns require a change in tower design standards.
I’m not a transmission engineer, but do recall hearing that tower building standards being more stringent (i.e. for higher wind speeds) in those areas that are traditionally exposed to cyclonic wind speeds (i.e. northern Queensland, up around Darwin, and in the northern parts of WA). Furthermore, I do know that other precautions are taken in north Queensland – for instance, Queensland’s 275kV backbone is further inland (which means it was the 110kV (more coastal) lines that were taken out during TC Yasi in 2011 and TC Larry in 2006, for instance.
Nevertheless, questions will be asked. At this point I would just flag that there’s a risk of ‘gold plating’ if there is a knee-jerk reaction to what’s happened… (again, let’s have a rational look at the data).
(D3) What is the repair process?
Obviously a key question for many people relates to the repair process that will be undertaken – with the key question for many being ‘when will it be back’?
At 17:21 on Friday 31st January the AEMO published Market Notice 73215 which noted that the line was not expected to return to service until Friday 14th February 2020 (i.e. 2 weeks away):
________________________________________________________________________________________________
Notice ID 73215
Notice Type ID Emergency events/conditions
Notice Type Description MARKET
Issue Date Friday, 31 January 2020
External Reference Update – Non-credible contingency event – Vic region – 31/01/2020
________________________________________________________________________________________________
AEMO ELECTRICITY MARKET NOTICE
Update to Market Notice 73176
At 1324 hrs the Moorabool – Mortlake 500 kV Line and the Moorabool – Haunted Gully 500 kV Line tripped resulting in South Australia separating from Victoria.
These transmission lines are currently scheduled to return to service at 1700 hrs 14/02/20. Please refer to AEMO Network Outage Scheduler (NOS) for details.
Manager NEM Real Time Operations
This, to me, seems an extraordinarily short time to return a transmission line like this to service – which suggests both:
(a) Some risk of slippage in the process (e.g. even if just due to bad weather!); and
(b) A multi-stage process being used – in the form of some form of ‘temporary’ towers being established for some semblance of flow by 14th February, with the real replacement work then being carried out in parallel and maybe taking 6 months or so.
(D4) What does the repair cost us (and what is loss of transmission costing us now)?
There is, of course, a particular nuance to this question – given the ongoing deliberations about the potential closure of the Portland Smelter – which would, if closed in the next few years, make the whole repair process look more expensive than it would otherwise be.
(E) Rumours love an information vacuum
It was 13:31 (NEM time) when the AEMO published Market Notice 73172 to announce the ‘separation event’ occurring at 13:24 in Market Notice 73172.
In the minutes that followed, which stretched into a couple of hours, there were many questions buzzing around about what went on (we received our fair share – and asked a fair number as well – but that would only have been a small fraction of the volume in the wholesale market and broader afield).
These questions became clearer when this image was tweeted by Simon Love around 15:29 (but note that this was 125 minutes after the Heywood link was down, and rumours love an information vacuum!):
This should not be read as a criticism of AEMO and the network companies, but more another reminder for us of the opportunity that’s there for companies like ours to improve what we do to make the key details as clearly as possible as soon as possible. Do you know of people who can help us?
Even with this key piece of information released, it took some time to filter out to the interested NEM participants, spectators and commentators. On top of that, it took even longer to piece together what it would all mean …. indeed, we are still working on that (as at Sunday evening!).
A few specific points about the information vacuum …
(E1) What happened with system frequency?
Coincidentally we have been progressing options for inclusion of frequency data into our ez2view software (more on that later) and so should shortly have another focused article up looking at what happened to system frequency in this islanding event.
Update Mon 3rd Feb: Using data polled on 5 second snapshots for system frequency in both Adelaide and Melbourne sourced from a vendor we are increasingly working with, we wrote about “What happened with System Frequency with the SA Islanding on Friday 31st January 2020?” on Monday 3rd February.
This did reveal other questions, about the short term (i.e. within the dispatch interval) response of various plant, which is something we are exploring and will post more when we have time…
Update Tue 4th Feb: Using AEMO’s 4-second SCADA data, guest author has looked at the initial responses of generators and batteries on the western side of the disconnection to help answer that important question of “How did the lights stay on in South Australia?” when the towers were blown over.
This did reveal other questions, about the short term (i.e. within the dispatch interval) response of various plant, which is something we are exploring and will post more when we have time…
(E2) What happened at Portland Aluminium Smelter
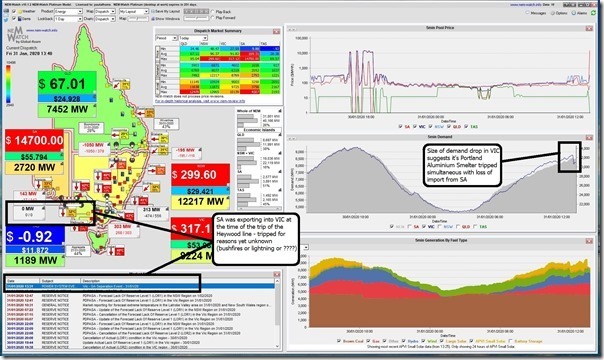
AEMO’s Market Notice (73172) about the separation event appeared in time for the 13:35 dispatch interval, as captured here in this image from NEMwatch v10, which I subsequently circulated on Social Media (here on LinkedIn and here on Twitter):
At the time I’d noted that the Portland Smelter had tripped in the immediate aftermath.
Following from that time, however, there was a significant volume of (often conflicting) rumours and claims circulating about ‘it’s back’ or ‘it’s not’ and even some ‘it’s cactus’ claims. We’ll explore this one with a focused article…
(E3) Understanding market data becomes more complex
A special note here, specifically given our focus on ‘making complexity understandable’ that this interim period until the network is back to ‘normal’ will make it more difficult to correctly interpret market data, given some of the nuances in the ‘not normal’ way in which some of the network is operating.
(F) Is Islanding becoming more common?
What happened on Friday last week obviously triggered memories of the SA System Black on 28th September 2016. However since that time, there have also been a number of other islanding events – including these:
Only 2 months on from the SA System Black, on Thursday 1st December 2016 South Australia had again islanded from the Victorian region of the NEM
There was a very near miss that occurred on 3rd March 2017 where South Australian very nearly went ‘System Black’ again.
On 25th August 2018 we had the rare double-islanding event, with both QLD and then SA separating as a result of storms passing through the QNI flow-path
On 16th November 2019 we had SA island from the Victorian region as a result of Heywood tripping.
Only a month ago(!) on 4th January 2020 we had NSW island from VIC as a result of bushfires cutting out transmission interconnection through the Snowy Mountains area
They were the ones I was able to tag at the time through articles here on WattClarity, so there might have been others.
Am I correct in thinking that this kind of event is happening more frequently now and, if so, what are the implications of this for the future?
(G) South Australia becomes the ‘accelerated accidental experiment’
Others like Matthew Warren have made much of the term ‘an accidental experiment’ to concisely describe what’s been evolving in the South Australia over the past decade as a result of the Australian push for renewables, a favourable wind resource in South Australia and – all on a back-drop of electricity prices that have historically been higher than in the eastern regions.
Well, we now have a real live case where this ‘accelerated accidental experiment’ is fast-forwarded into the future, a number of years ahead of when it would have otherwise arrived. Apart from the ability to import a limited amount of power over the (DC-based) Murraylink interconnector (which provides no support for System Strength or Intertia), South Australia is on its own until the backbone back to Melbourne can be fully restored.
I’ve seen others on social media celebrating the fact that (by happy coincidence) the forecast temperatures for South Australia are for relatively moderate summer weather in the coming couple of weeks – whilst there’s certainly some elements of something to be thankful for in this respect, it also seems likely that it will have its own negative implications for the way the SA grid is operated in the coming weeks. Lower temperatures will mean lower demand – so a smaller addressable market, which will be reduced further (for non-synchronous plant) by the necessity of leaving headroom for synchronous plant to operate and deliver the necessary technical support.
We discussed some of these challenges in various places through the GRC2018, and then copied some of this out into this article on 12th August 2019 discussing the trended MIN, AVE and MAX levels of (generation-supplied) inertia in the South Australian region of the NEM. Noting that there are now (I believe – not exactly sure on dates) synchronous condensers connected into the SA grid, I believe that these data points will still give readers a sense of the challenge.
In summary:
1) I would expect that operators of Wind Farms and Solar Farms in the South Australian will be taking a haircut on the revenues (for ‘Black’ energy, but also for the LGCs) because of increased amount of curtailment whilst the
2) I would not be surprised, for instance if Non-Scheduled non-synchronous plant (e.g. smaller wind farms – and potentially even rooftop PV systems) were curtailed at times until Heywood is back.
I’d noticed that Matthew Warren had written about ‘A very quiet energy revolution’ in the AFR on only on Thursday (30th January), speaking about the probability that the opening of the interconnector between SA and NSW would lead to closure of gas-fired plant in South Australia (or some form of subsidy to keen them running).
1) This view has been echoed by others – though notably not unanimously.
2) The coming couple of weeks will provide food for thought, with respect to the longer term, as well.
(H) Exacerbated co-optimisation challenges
Worth singling this one out for particular attention – the past few days are a reminder that co-optimisation (between Energy and FCAS) really matters, and the days of just looking at Energy Prices in isolation are well and truly passed.
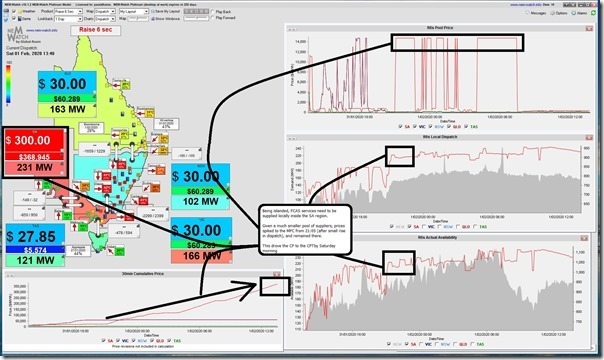
This snapshot from NEMwatch v10 from 13:40 on Saturday with the ‘Layer’ flipped to show the Raise 6 second FCAS services for all 5 regions, and I have highlighted what’s been happening in South Australia since the islanding event:
Note that Raise 6 second Prices have already hit the the Cumulative Price Threshold for the South Australian region (but note that prices there only started spiking late on Friday – well after the transmission towers were down and the .
Particularly with respect to South Australia:
1) Participants who are registered to be providing FCAS services will be especially mindful of the market power that they have for provision of FCAS services in the absence of interstate competition.
2) However it does not end there, as generators will be increasingly looking at the costs they are incurring for the FCAS services the grid is requiring.
(a) These costs are important everywhere (and for some participants much higher than you’d ordinarily think) which is why we included a monthly break-down of these costs through CAL 2019 in the GSD2019.
(b) In South Australia in particular this will be worth watching closely in the next few weeks, with some generators conscious of the choice that confronts them (turn off to save on FCAS recovery charges, or continue running to provide the energy the grid needs).
An excellent reason for ez2view clients to be upgrading to the latest ‘bleeding edge’ version of the software in order to see the new ‘NEM Prices (BETA)’ widget that now has an enhanced display of all 45 commodity prices (including in the ‘physical dispatching’ run under intervention, which we will be seeing a lot of in the coming weeks)…
(I) Longer term questions about Alcoa’s Portland Aluminium Smelter?
As best as I can work out, some power is being supplied back to Portland Aluminium Smelter by backfill from the South Australian grid and with support of local generation (e.g. Mortlake GTs, and possibly some wind farms as well). More on that later…
However it needs to be recognised that:
1) This would not be inherently as stable a supply as would ordinarily be the case for a number of reasons, including:
(a) Reduced reliability of supply from South Australia (i.e. single source of failure);
(b) On top of being tied to the ‘accelerated accidental experiment’ that is now the SA grid; and
(c) On top of this, grappling with the vagaries of paying the VIC prices for Energy and FCAS, whilst at the same time not gaining any of the benefits of connection to the VIC node of the grid.
2) It’s highly unlikely that the smelter is back up at full load (hence lost production), and may need to be operated at minimal load (i.e. just enough to keep the pots from freezing) for a non-trivial number of hours until the transmission network is repaired.
What impact does this have on the ‘should I stay or should i go now?’ deliberations that have been the focus of considerations at senior levels within Alcoa? Is this just another nail in the coffin of Portland – and, by extension*, aluminium smelting elsewhere in the NEM.
* noting that the larger Tomago Aluminium Smelter has been affected over the past few days as well – and Boyne Island and Bell Bay have had their own questions asked…
(J) Smaller retailers pushed to the wall?
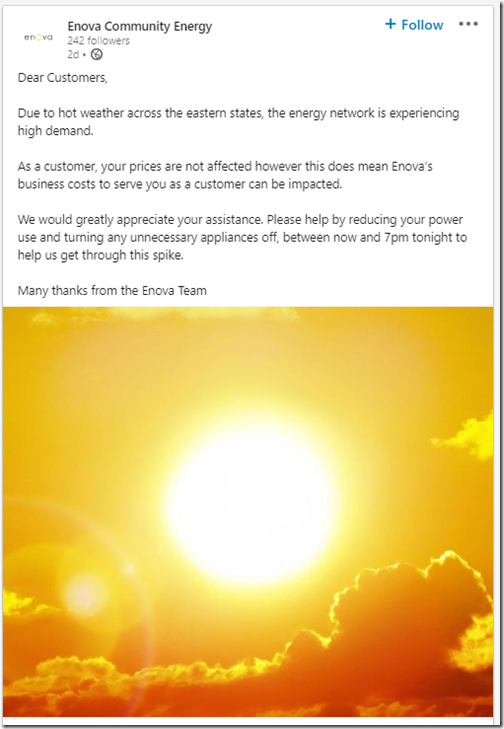
We did note this very personal appeal, by Enova Energy (start-up retailer), to its customer base for help on Friday:
This summer has been a big one for both of the main aspects of risk that drive retailers to the wall:
1) We’ve seen some periods of extreme volatility (such as this recent Thursday, Friday and Saturday); but (coupled with that)
2) We’ve seen extremes in temperatures driving demand to extreme levels – hence presumably flexing retailer load shapes beyond hedge levels.
I can imagine that it’s a combination of those factors that led to Enova’s please to its customers.
It’s been a while since we’ve had retailers implode* in the NEM, but what’s happened this summer (and watching retail businesses going to the wall in the UK as well) makes me wonder if there are some others that are close to shutting up shop in the NEM?
* I can remember Jackgreen flaming out, and then also Energy One as a retailer (ironically pivoting their business into development and sale of risk management software), and more recently we had Go Energy – plus some close shaves, like with Australian Power & Gas (saved by a lifeline to AGL Energy).
There are bound to have been others that have died, or come close, that I have forgotten.
This loops back to the note at the top about ‘the level of risk escalating’ in the NEM.
(K) What role did Demand Response play?
We’re a keen supporter of Demand Response in the NEM. A bit over a year ago now, I posted this overview of some of the different ways we’d been supporting Demand Response for (even at that time) over 15 years in the NEM.
Hence I am very interested to piece together the variety of different ways that Demand Response helped – not only on Friday 31st January, but also Thursday 30th January (VIC and SA) and Saturday 1st February (NSW).
On Friday 31st January, we also saw other interesting developments with demand – for instance the Scheduled Demand in the SA region jumped immediately after the separation. We believe this to be the result of the resultant tripping of rooftop PV systems enmasse, thrusting a lot more ‘behind the meter’ demand back onto the grid. We need to explore this to know.
(L) An objective review of the villains and heros on the supply side
‘Apportioning Blame™’ increasingly seems to be the latest blockbuster game that many like to play as observers of the NEM (and I know I’ve not been immune to its temptations at times). I look forward to reviewing in more detail specifically what happened particularly on Friday 31st January (as I have already had this brief look at Saturday 1st February).
(M) How much better are we doing than in the SA System Black?
Late on Friday the team at AEMO were quite understandably exhausted by what they had managed to pull off – and also, I would assume, a little relieved that not even Load Shedding had been required at the end of the day (which is, in itself, quite remarkable). I expressed my own appreciation on Friday evening.
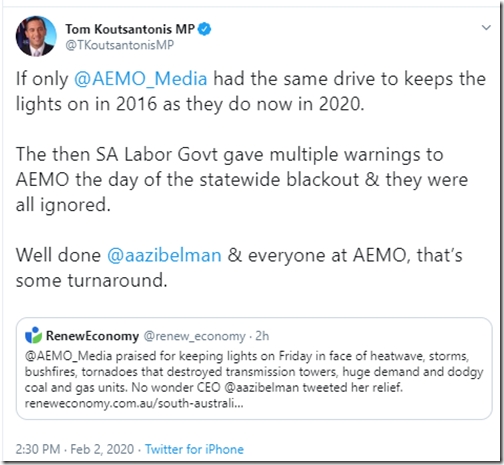
Others have also been quick to pat AEMO on the back – with former SA Energy Minister drawing direct contrast to the SA System Black:
What role did good luck play in events on Friday?
For instance, the point at which the transmission network was severed meant that Portland load also tripped coincident with supply from Mortlake (and a lesser amount from Macarthur WF etc). Hence the net result was (we think) evenly balanced – we’ll know more when we get to the bottom of the frequency traces…
It won’t be my central focus (not my role) but the analysis I’ll be doing, some of which is outlined above, will also throw up interesting questions about what aspects the energy sector has improved in, and where future improvements can continue to be delivered…
(N) … but wait, there’s (undoubtedly) more!
No doubt the digging we’ll be doing will throw up other threads – but those 13 points above are a handy place to start to focus…



![2020-01-31-at-15-29-tweet-SimonLove-[1] 2020-01-31-at-15-29-tweet-SimonLove-[1]](https://wattclarity.com.au/wp-content/uploads/2020/02/2020-01-31-at-15-29-tweet-SimonLove-1.png)
It does appear that the design of the towers is nowadays inadequate to withstand extreme weather events. I would have thought that a engineering assessment of the transmission towers would have been done after the 2016 blackout. Maybe it was but the results not released? Regardless, the towers’ ability to withstand extreme weather needs to be upgraded.
Hi Paul thanks for the insights. I’m interested in the winners and losers of this islanding noting that the Hornsdale Power Reserve has made over $14 million on FCAS markets since the separation. Looking at the GSD2019 this is more than half of what it made on the FCAS markets in 2019!