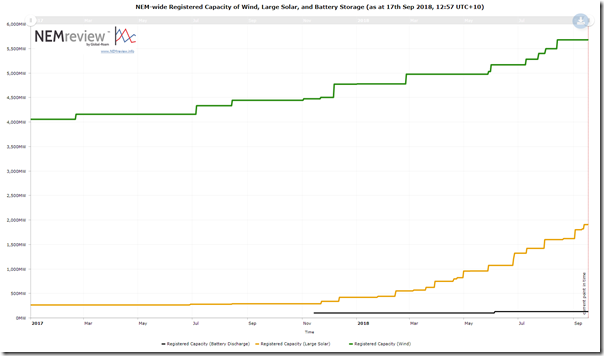
Over the past 18 months, there’s been a sizeable amount of new entrant wind and solar plant enter the National Electricity Market. Using NEMreview and this query, we see daily Registered Capacity for wind and large solar growing as follows:
In parallel with this, we’ve been having an increasing number of conversations with new entrant generators who are coming to the pointy end of the construction process of their Semi-Scheduled wind and solar plant. Some of these new entrants have been coming onboard with our ez2view software, to help them actively manage the opportunities and risks for them present in the NEM.
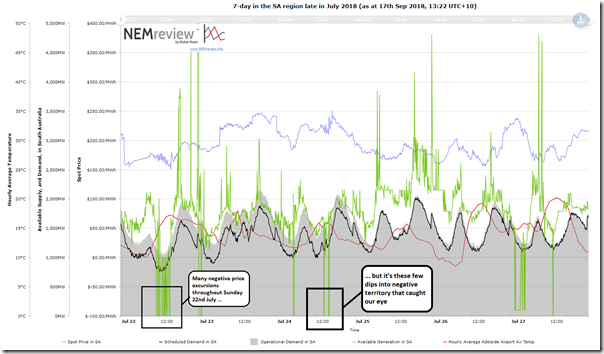
During a conversation late in July, I was using the Time-Travel functionality in ez2view to walk sequentially back through some interesting market events and I happened upon the afternoon of Tuesday 24th July 2018 (a period highlighted in the NEMreview trend below):
At the time we were discussing the need to actively manage their bids submitted to AEMO – due to a number of factors, including risks relating to congestion, and negative price events. Coincidental, therefore, that we happened on two occasions in the afternoon of Tuesday 24th July that featured dispatch prices dropping to –$1,000/MWh and we noted the reaction of Lake Bonney 2 Wind Farm (another Semi-Scheduled plant) to that risk.
To the person I was speaking with at the time, I promised to put an article together and post on WattClarity. It’s taken longer than I expected to find the time to do so, but here it is today.
In putting this post together, we’ve used the “Time-Travel” function in conjunction with an “in development” version of ez2view that contains functionality not yet completed and delivered to clients. Given the intensive, ongoing but iterative development process we follow with the software, we’re always working on enhancements to the software in various ways. Using the software in analysis to prepare posts like this helps us fine-tune what we’re working on at the time, by continually asking ourselves “does this [NEW FUNCTIONALITY] make the complexity more understandable?”. Hence we’d be interested to hear directly from existing clients to see if what’s new in some of the images below (flagged) makes the story clearer?
We’ll step through a number of dispatch intervals successively, to see what unfolds during the day. Our ez2view software allows the user to configure their own dashboard over multiple windows, so we’re going to use 2 windows to highlight various aspects of what was happening in the South Australian region of the NEM in that time.
In doing this, keep in mind that the two instances of negative prices are for the 14:35 dispatch interval and the 16:05 dispatch interval. In both instances, these are the first dispatch intervals in a trading period, so offer more examples of generator revenue management due to the challenges associated with 5-minute dispatch and 30-minute settlement that are with us until 1st July 2021.
We’ll look at each of these instances in the context of the whole trading period, and (importantly) what was visible in advance, particularly highlighting the active steps that Infigen Energy (the operator/participant) has taken in order to manage the risks inherent in both negative prices and specific constraints at the time.
Readers are reminded that times here are in “NEM time”, which is UTC+10.
(A) The 15:00 Trading Period (i.e. from 14:30:01 to 15:00:00)
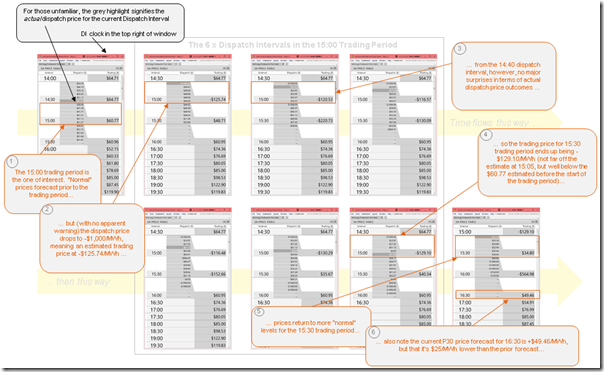
Using Time Travel in ez2view we’ve wound back to each of the 6 x dispatch intervals in the 15:00 trading period, plus one on either side, to present this longitudinal view (click on the image for a larger view):
The key points to start with are that:
1) The dispatch price dropped to the Floor at 14:35, the first dispatch interval in the half hour – which delivered a trading price down at –$129.10/MWh (which, even allowing for revenue from LGCs, would seem to be an unprofitable price for any generator for that half hour).
2) This price drop was not envisaged in the P5 predispatch forecast produced prior to the first dispatch interval – hence we presume that all generators were surprised by the specific timing of it’s occurrence (even if they understood the risks of this happening were heightened because of wind patterns over that recent period).
(A1) The 14:30 dispatch interval (before the trading period begins)
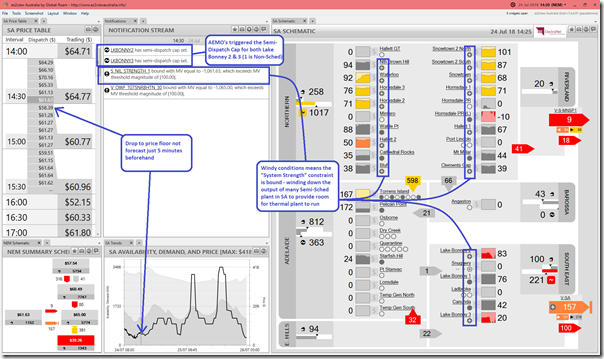
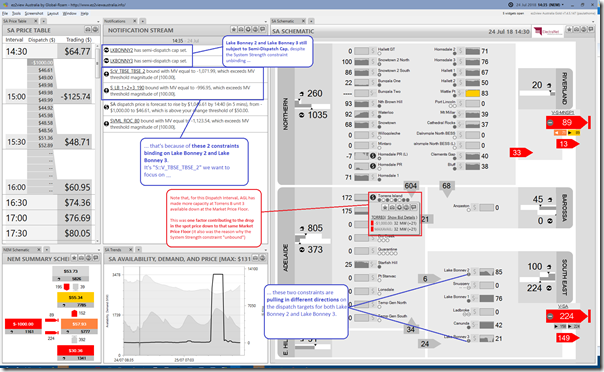
If we load up another window from ez2view at 14:30 (this time containing a juxtaposition of several widgets) we see the conditions :
I’ve flagged three things in the image:
1) Reiterating no price drop forecast at the time
2) Highlighting that the AEMO had triggered the Semi-Dispatch Cap on Lake Bonney 2 and Lake Bonney 3 (along with a long list of other generators, not shown) in order to notify them that they need to pay attention to their dispatch targets, as the AEMO requires them to do something in order to keep the system stable. We’ll have more of a look, later, at what AEMO was asking these plant to do – just need to flag that the SDC was triggered at this point.:
(My) Layperson’s Description of the Semi-Dispatch Cap
In response to the influx of intermittent generation supplies entering the NEM some years ago (back when it was mainly wind farms) a “Semi-Scheduled” registration classification was created at the AEMO. When (wind and solar) plant register at AEMO, they fit into this category.
The way this works is that the Semi-Scheduled plant are required to bid into the market (almost) like fully Scheduled plant – in that they offer 10 bid bands and allocate quantities across the bid bands. However they do this on the basis of their physical capacity on the assumption that AEMO (through AWEFS and ASEFS) will adjust their volumes to what’s actually realistic in each dispatch interval in real time. This is notwithstanding the challenges inherent in 3rd party forecasts of plant output as discussed here.
Most of the time, the wind & solar farms will just produce as much as the wind & sun allows (i.e. effectively not paying any attention to what their dispatch Target says, when calculated by NEMDE) – but occasionally AEMO might need them to operate in a certain way to ensure system stability. If this is the case, then this would be signified by AEMO triggering the “Semi-Dispatch Cap” for that particular DUID, which is a flag for the unit to “follow” their dispatch Target.
When we say “follow” there is a difference, too, from the Scheduled plant, which have to hit their dispatch targets (i.e. not too high, nor too low). For the Semi-Scheduled plant, the Target effectively acts as a Cap – i.e. AEMO is telling them to “don’t produce any more than Target MW” at the end of that dispatch interval.
Clients using our ez2view software, when pointed at their own MMS (i.e. containing their own private data feed from AEMO) will have visibility in real time of their Semi-Dispatch Cap status and also their Dispatch Targets – plus the forecasts into predispatch as well. When using Time Travel we can (almost – see note at bottom of article) have a complete view of what the participant might have been seeing in real time.
———————————————————–
Important to note that batteries need to register as (fully) Scheduled plant, so this does not apply to them – indeed, their operations are more complex and need (very) Active Management.
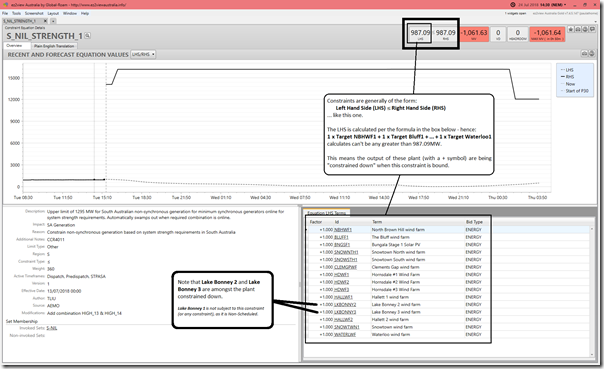
3) It’s also noted that the “System Strength” constraint was bound at the time. We can click on the Constraint Equation name to open a new window to learn more about this particular constraint:
I’ve highlighted here how Lake Bonney 2 and Lake Bonney 3 are amongst the 15 wind and solar stations that are being constrained down for System Strength reasons prior to the start of the trading period in question:
Quick note about the System Strength constraint
In the aftermath of the SA blackout of September 2016, the AEMO has implemented some constraint equations that have the effect of constraining down intermittent (non-synchronous) generation in South Australia (i.e. when its very windy) to provide room for what they deem to be sufficient thermal plant to operate in order to provide enough “System Strength” on the grid to keep the system stable should unforseen events occur.
This constraint tends to bind for hours at a time and returns every few days (i.e. coincident with the windy periods in SA). We expect it will become more prevalent in future, as more intermittent plant comes onto the grid in South Australia. Might also occur in other places as well (e.g. in North Queensland with the influx of solar plant).
There have been several different forms of this constraint over the 2 year period since the blackout, with the latest form shown in the widget above. It may be that the form of the constraint continues to evolve over time – any such changes will be automatically reflected in the data conveyed through widgets in ez2view.
Because of the lack of diversity of wind patterns across South Australia (and indeed the south-east corner of the NEM, more broadly) we see this System Strength constraint binding almost every week for hours at a time. In the ordinary course of events this means a lower yield from all of the Semi-Scheduled plant on the list (hence lower “black” revenue (lower volume and a suppressed spot price in a double whammy as a result of the “wind correlation penalty”), and also lower LGC revenue as well – another risk to manage, but that’s food for another article).
On this day, the concerns were a little bit different…
(A2) The 14:35 dispatch interval (price drops to the floor)
Step forward five minutes and we see a number of things (including the price drop down to the Market Price Floor of –$1,000/MWh):
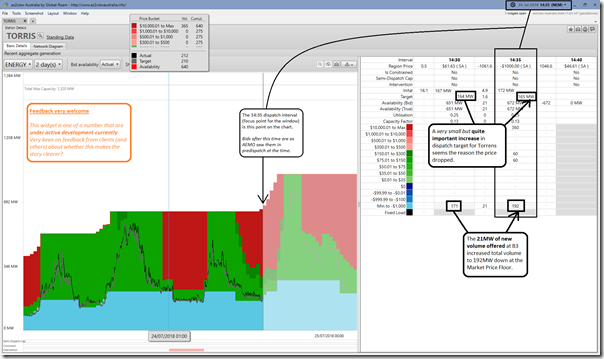
Firstly let’s highlight the small change in bids at AGL’s Torrens Island B3 units. In this case (highlighted in mouse-over) the unit made more capacity available down at the Market Price Floor. Drilling into the “Station Dashboard Widget” (under active development) we see what impact that had on the station itself:
So the extra volume offered down at –$1,000/MWh when it came online led to both:
(a) a small (but quite significant) increase in dispatched volume at that plant itself; and
(b) the lifting of the “System Strength” constraint*, which allowed wind farms to ramp up output further.
* about the unbinding of the System Strength constraint
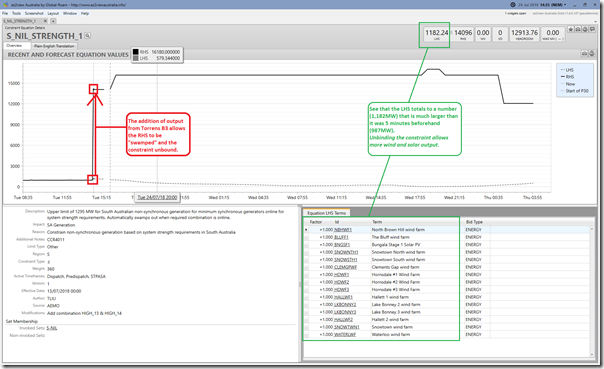
In layman’s terms, the depth of the limitation on output of non-synchronous (but Semi-Scheduled) plant in South Australia under this constraint is determined by combinations of different synchronous units that are online at the time. By coming back online, the TIPS B3 unit added to the number of synchronous units (even if at low output) and so the constraint was relaxed.
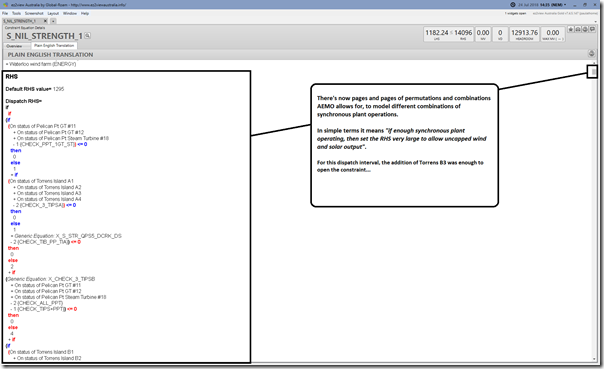
This is done through a “swamping” term on the Right-Hand Side (RHS). Further details are shown in the two images below from that particular widget in ez2view.
This combination of increased output (i.e. a bit from TIPS B3, which allowed a lot more from wind and solar) crashed the price through the floor.
Here’s where you can see the gory details of the Right-Hand Side (RHS) of that constraint in ez2view:
If I sit back I can almost see the news headline in an article that would probably never be written: “Not-so-greedy (at least this time) thermal generator gives away more capacity, ensuring greater output from wind farms and delivering negative prices for consumers”.
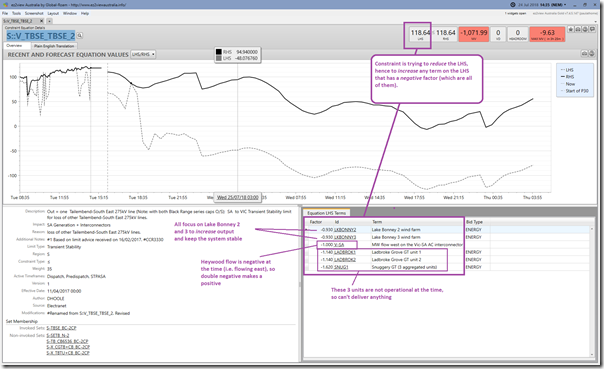
So despite the fact that the System Strength constraint was no longer material in this dispatch interval, we see that Lake Bonney 2 and Lake Bonney 3 were still subject to constraints, and (in fact) two of them, highlighted in the image above. It’s the constraint “S::V_TBSE_TBSE_2” that is of most interest to us in review of what happened on 24th July:
The reason for this is because this constraint is acting to wind up the output of Lake Bonney 2 and Lake Bonney 3!
In layman’s terms, SA was exporting to VIC (because of lots of wind). These are seen as negative flows in NEMDE. Because of this, AEMO is trying to ensure that generation in the South-East of South Australia is generating as much as possible in order to cover transient stability risk in the south-east. However neither Snuggery nor Ladbroke Grove are operating at present (and Canunda and Lake Bonney 1 are Non-Scheduled), hence the music stops, and Lake Bonney 2/3 don’t have a chair.
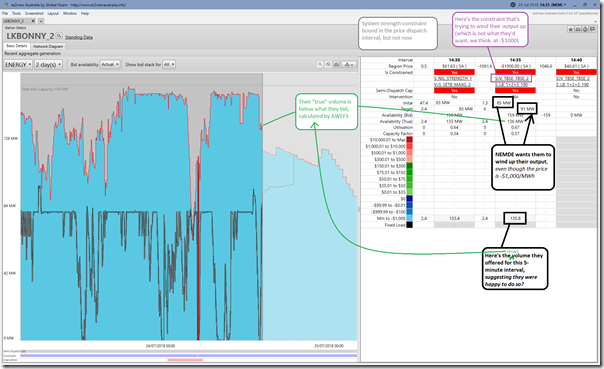
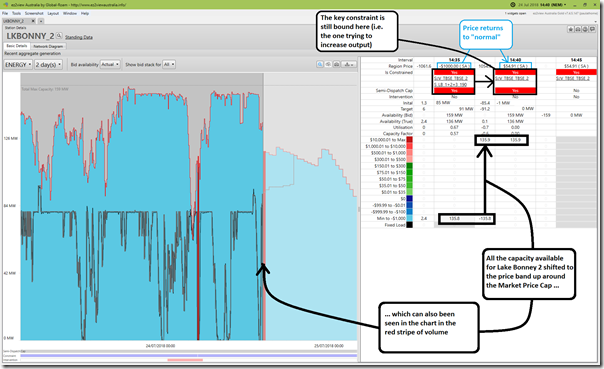
With the dispatch price at –$1,000/MWh they are being asked to “take one for the team” and generate as much as they can to keep the system stable. Here’s the same Station Dashboard view for Lake Bonney 2:
Remembering that the estimated trading price for the half-hour was down at –$125.74/MWh (i.e. not down at –$1,000/MWh, but still real money to fork out for the privilege of generating) this would calculated out at an amount of $7,104.31 that the participant (Infigen) would need to pay for generation over the half hour, especially because AEMO was asking them to ramp up!
No wonder that these plant, and a number of others, were seen to rebid in the next dispatch interval. An example of the need for Semi-Scheduled plant to actively manage their risk!
(A3) The 14:40 dispatch interval (price recovers, but offer re-priced and output curtailed)
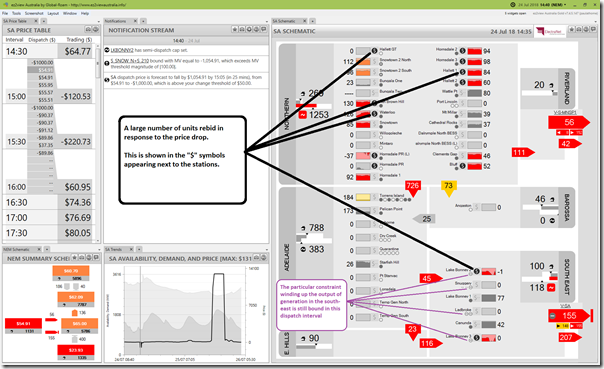
Here’s the summary view, 5 minutes later:
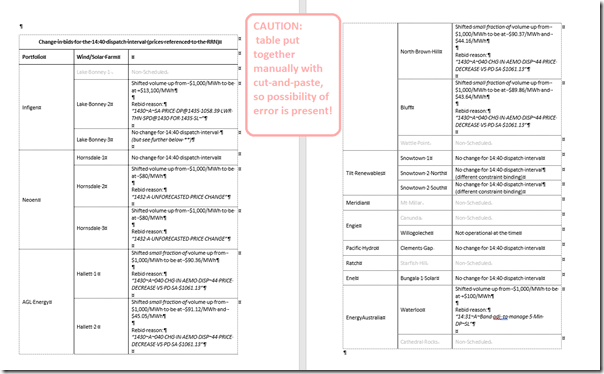
It’s scope for more analysis (and hence food for another article on WattClarity sometime) but we note that some portfolios did rebid whilst others did not. Whilst recognising the inherent impossibility of knowing a participant’s motivation (and also recognising potential for error in manual cut-and-paste), it does not help us wondering what this behaviour could tell us about the exposures of each of these portfolios, and their capacity/motivation to actively respond to market events:
Here’s the view of rebidding at Lake Bonney 2 for the 14:40 dispatch interval:
(A4) A question emerges…
The above was pretty much the essence of what I envisaged posting to deliver what I promised to in my conversation to the new entrant in late July. Job done, I thought initially…
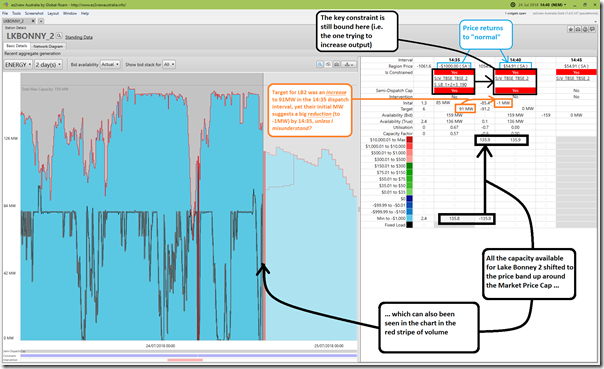
However perhaps by the virtue of time to think further (or because the enhancement to the “Station Dashboard” widget made it clearer) I noticed something in particular, relating to the “Initial MW” field for the Lake Bonney 2 project – highlighted here with the same widget focused on the 14:40 dispatch interval, just with an additional comment added:
Remember that “Initial MW” is a snapshot taken at the start of a dispatch interval indicating where AEMO sees the unit to be, whereas the “Target” is what the AEMO wants the unit to be generating at the end of the period (albeit for Semi-Scheduled plant it is more like “don’t generate more than X”).
As noted in the comment, it seems like AEMO was asking Lake Bonney 2 to ramp up (wind permitting) to 91MW by 14:35 (i.e. at the end of the 14:35 dispatch interval) and yet their Initial MW for the 14:40 dispatch interval (i.e. snapshot taken at the start of the dispatch interval) suggests that their output went the other way.
As highlighted in this particular image, the Lake Bonney 2 wind farm was already sitting at 0MW at the start of the 14:40 dispatch interval. Yet, in the prior dispatch interval:
1) Lake Bonney 2 had offered all of its capacity in at –$1,000/MWh and, as such
2) The dispatch target that resulted was such that AEMO expected that the plant increase its output (as much as the wind conditions would allow).
I wonder whether I missed something big, and would ask the more learned of our readers to please weigh in with comments (below, or offline) if you know of things I have missed?
(A5) … hence we delved into the 4-second SCADA data again to confirm our hunch
Notwithstanding that we’d bumped into a few warts in the 4-second SCADA data the last time we tried to use it, and that we’re very much in training wheels in how it is structured (and in terms of when to use it, and when not to) I thought it would be educational for us to have a look at what the SCADA data showed us for the same period.
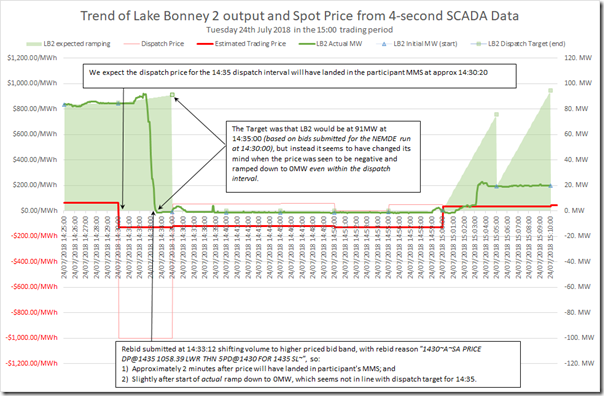
Here’s what we pieced together for the Lake Bonney 2 station:
Note in the chart I have time-shifted the “Initial MW” numbers to coincide with the measurement point at the start of the dispatch interval (i.e. where the SCADA snapshot is supposed to be taken). As it turns out, this lines up pretty well with the 4-second SCADA data. There is a big assumption inherent in the above, notwithstanding that alignment (i.e. we assume that the time stamps on the SCADA data are exactly correct).
Assuming that this is the case, it appears that the ramp down started at Lake Bonney 2:
(a) Well within the 14:35 dispatch interval (which is not what would seem to have been the undertaking in the bids used for that dispatch interval); and
(b) Might have event started slightly before the rebid was submitted for 14:40.
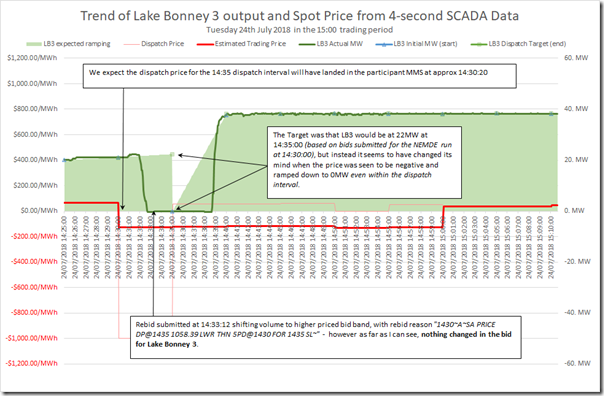
This observation is ringing bells inside my head, highlighting that there must be something here that I am overlooking – or have misunderstood. Out of curiosity, we looked at Lake Bonney 3 and saw a similar pattern:
Also interesting to note here that (as highlighted in the table above) there was no change of volume offered for the 14:40 dispatch interval for Lake Bonney 3 (unlike Lake Bonney 2) and yet the volume was still curtailed prior to the end of the 14:35 dispatch interval.
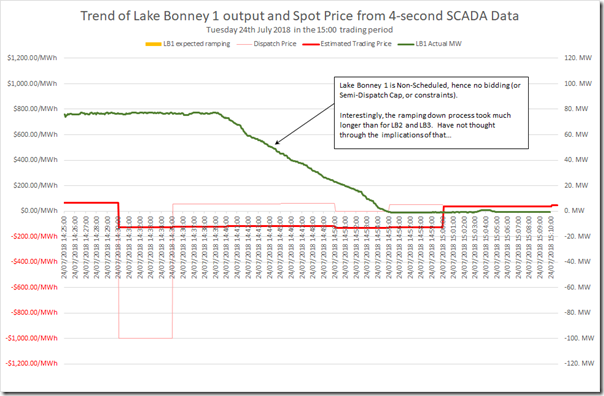
Finally, for completeness we include the trend of SCADA output data for Lake Bonney 1:
Being Non-Scheduled, there’s not as much data relevant to that station (but we do see that the ramp-down was much more gradual, and wonder if that was because of contract cover or for some other reason).
(A6) Recapping my understanding of the sequence of events at Lake Bonney 2 and Lake Bonney 3
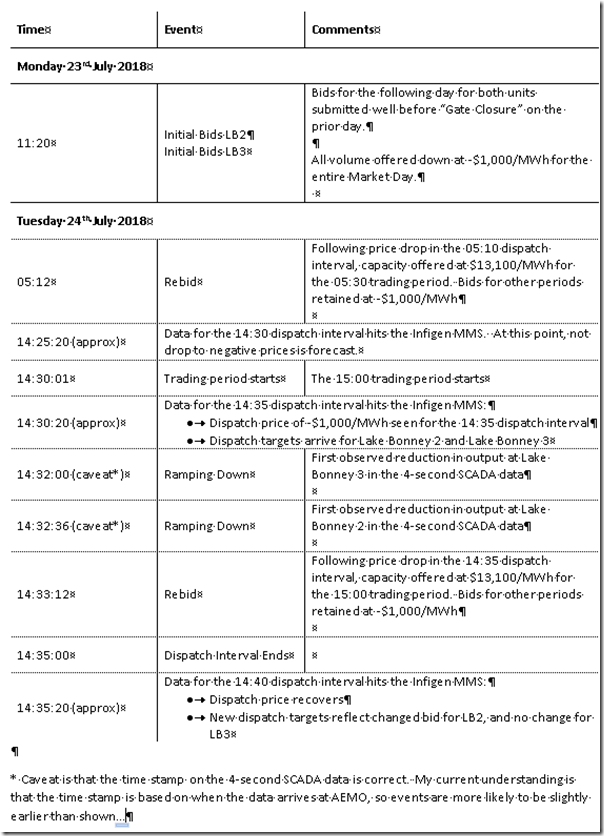
As noted in these images, the rebid Lake Bonney 2 was accompanied by a reason “1430~A~SA PRICE DP@1435 1058.39 LWR THN 5PD@1430 FOR 1435 SL~” which makes it pretty clear that the drop in the dispatch price to –$1,000/MWh for 14:35 was the reason claimed for shifting volume to the market price cap. Lake Bonney 3 was tagged with the same rebid – but (unless I am missing something) nothing changed in their bid.
We’ve put together the following sequence of events to reflect our understanding (noting that it may be that we have misunderstood something, and would appreciate people pointing this out for us, if they can please):
As noted in the table above, the ramping down of Lake Bonney 2 and Lake Bonney 3 appears to start prior to the rebid for Lake Bonney 2 being time-stamped by the AEMO, and 2.5-3 minutes before the end of the dispatch interval in which the targets for the units were for an increase in output.
(A7) Questions about specifics of Active Management, specifically relating to “Bidding in Good Faith”
At this point, I’ve bumped into the limit of my understanding – and am hoping that some of our more learned readers might be able to point me to any case where the AER has analysed and reported on similar behaviour to what seems to have happened here on 24th July? I am very deliberate in using the “seems to have” phrase, as it may be that I have made some error in the data above (I hope not – but if so, please let us know urgently!) or made some mistake in its interpretation (perhaps more likely – but still please do let us know).
As the Semi-Dispatch Cap was triggered for both units at the time, it was a requirement that they “follow” the dispatch target – with my understanding being that “follow” effectively means don’t exceed. Hence, in that sense curtailing down to 0MW before the end of the dispatch interval would presumably not be seen as contravening the dispatch target.
What puzzles me is that “bidding in good faith” would actually mean for a Semi-Scheduled plant operating in circumstances like these. Given the bids down at –$1,000/MWh were taken account of by NEMDE in calculating the dispatch outcomes for 14:35, I could understand an argument being made that bids for Lake Bonney 2 and Lake Bonney 3 might not have been in “good faith” if the operator seems to demonstrate that they don’t like the outcome by curtailing output before the end of the dispatch interval, and (slightly later) submitting a rebid noting the price change. Seems to be a bit of a grey area?
It would be great if there was some readers out there who could help me out on this one, please?
Quick note about (my understanding of) ”Bidding in Good Faith”
My layman’s understanding of what “bidding in good faith” means is that the generator needs to be genuinely prepared to honour the bid if called onto dispatch in that dispatch interval.
This followed a rule change proposal submitted by the Minister for Mineral Resources and Energy (of South Australia) on 13th November 2013 which referenced the earlier Federal Court decision in August 2011 (link here to come) relating to a case brought by the AER against Stanwell Corporation for bidding behaviour on 22nd and 23rd February 2008 (outcomes of which we happened to capture here on WattClarity at the time, and I note that our software has come along way over the 10 years since).
On 10th December 2015, the AEMC made a final rule to enhance the arrangement that govern all generator’s offers in the wholesale market. Details are here on the AEMC’s website, but my understanding is that:
1) It increased the requirements for contemporaneous documentations; and
2) Applied to Semi-Scheduled plant as well as Scheduled plant.
(B) The 16:30 Trading Period
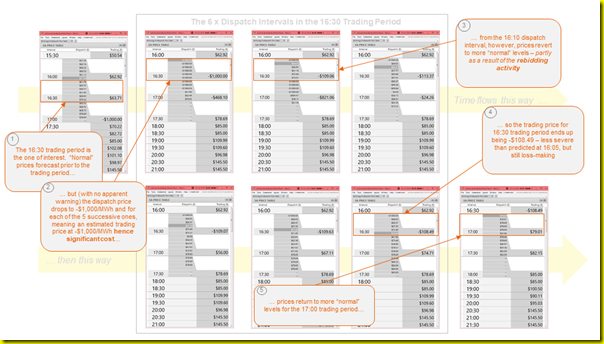
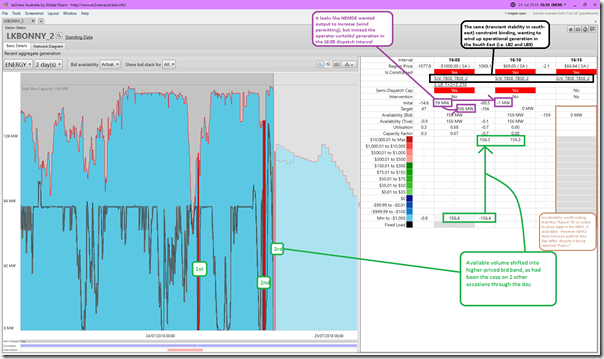
Assembling this article has already taken long enough (far longer than initially envisaged in that conversation with a new entrant back at the end of July), but it is worth presenting the same style of longitudinal view of prices for the 16:30 trading period, we see a similar story – with the dispatch price dropping to the floor in the first dispatch interval in the period.
What was different this time is that the AEMO P5 forecast was also flagging that the prices for the remaining 5 x dispatch intervals in the trading period would also have been so low – meaning an estimated trading price for that half-hour down at –$1,000/MWh.
It’s entirely understandable that all generators (or at least the party in the commercial arrangement that wears the risk) wants to avoid paying so much to generate (for instance, we have other quite small generators who are clients who have an automated data feed from us to turn them off when the price drops negative – reverse Demand Response, in a way). With the bigger generators that are involved in the dispatch process as Scheduled or Semi-Scheduled, they need to do this through the bidding and dispatch process.
Again loading up the same window focused on Lake Bonney 2 Wind Farm and focusing on he 16:10 dispatch interval (i.e. after the price drop at 16:05), we see what appears to be the same behaviour:
Puzzling…
Looking forward to hearing from our learned readers who can point out what I have got wrong, or misunderstood, please?
Finally, it’s also worth noting (a little off the topic of this particular incident) that the right column in the table in the widget is coded to show P5 predispatch data, if it is available. It will show a participants own predispatch in real time (we know this) and should show all “old” forecasts from day after (like in the image above) – however the AEMO does not even publish this day-after, despite it being labelled “Public”. Something we are following up with them about…


Hi Paul,
although I can’t contribute to clearing up these obscurities, I’d like to thank you for yet another great article that helps anybody trying to get a better understanding of the NEM.
I especially liked the “quick notes” in the squares as a kind of glossary.
Many thanks, keep up the great work!
great article Paul
As an aside tThis might interest the number crunchers at Wattclarity as they’ve released the cost of the Tesla big battery and Hornsdale wind farm facility-
https://www.msn.com/en-au/news/australia/tesla-battery-cost-revealed-two-years-after-sa-blackout/ar-BBNBBaD
That’s an investment of $900/KW but if wind can only produce 30% of that on average that jumps to $3000 and then the question of what sort of investment cost per guaranteed kilowatt 24/7 all year round? Marginal costs are low but what’s the bottom line for a level playing field kilowatt of battery backed wind power here?
Thanks for putting this together, Paul–quite interesting. I will preface by saying I’m working from knowledge of other systems and have no specific familiarity with AEMO, so I hope you’ll correct misinterpretations.
If I understand correctly, it looks like they are abusing the Target, which seems to penalize injections above the desired dispatch point but not below. Since this underproduction has to be balanced by providers of FCAS, I would expect there to be a penalty of some kind–does that exist in AEMO? If not, given how quickly they seem to be able to ramp down, the -$1,000 bid is strategically correct (although maybe not good faith).
I am a bit surprised by the speed with which the rebid is incorporated. Based on the timeline, a rebid at 14:33:12 gets incorporated into the SCED in time for the 14:35-14:40 interval. It’s also confusing that dispatch instructions for that interval only arrive at 14:35:20. Am I misunderstanding this timeline?
A semi-related question: does AEMO use a multi-period dispatch model?
They are bidding in good faith because they intended to honour the bid before market conditions changed.
Their rebid describes the market change that required a change of bid. Maybe Torrens should have rebid a little earlier eh?
Insofar as the constraint is a submarket within the NEM they have to sell at -1000 to remain generating. When the submarket begins to impact the actual dispatch price they have to change bid.
Paul, I trust you will be highlighting all of the gas generator rebids for “avoid uneconomic start” where they fail to ramp up 100 MW when prices spike?
I find it laughable that you expect Infigen to cop massive losses due to extremely complicated market conditions. Keep in mind that during these periods of Intervention pricing that predispatch price is totally misleading. Traders are flying blind and NEMDE is trying to minimise their revenue. Good luck out there!