
Background
Yesterday (Wednesday 28th January) saw demand across the NEM jump to unprecedented levels. We reported this early in the afternoon, at which time we noted the peak NEM-wide demand was 34,524MW at 14:10 NEM time.
However, we continued to watch and saw demand continue to climb through the afternoon, to set a new record of 34,843MW at 16:00 NEM time on Wednesday 28th January.
As noted at the time, this was almost 3,000MW higher than the peak (NEM-wide) summer demand experienced in any previous summer, which would be:
- A load roughly equivalent to the demand of a city the size of Brisbane; and
- About half the average output of all the generators located in the Latrobe Valley in Victoria.
- This amount of peaking generation capacity would cost somewhere in the order of $3 billion to construct.
Hence, it was a massive increase in demand.
On Thursday 29th January, we saw the demand increase still further, leading to prices that stayed high for much of the day (to the point where the Cumulative Price Threshold was reached in VIC and SA and price caps were imposed), and a relatively small amount of involuntary load shedding occurring in VIC and SA.
- 1) Background
- 2) Contents
- 3) Peak Demand Levels
- 4) Price caps imposed (in SA, then VIC)
- 5) Involuntary Load Shedding
- 6) Trip of Basslink
- 7) Lessons Learnt?
- 8) Conclusion
The following table (which we’ve pinched from NEM-Watch at the end of the day) has been included to highlight when demand peaked across each of the regions over the day:
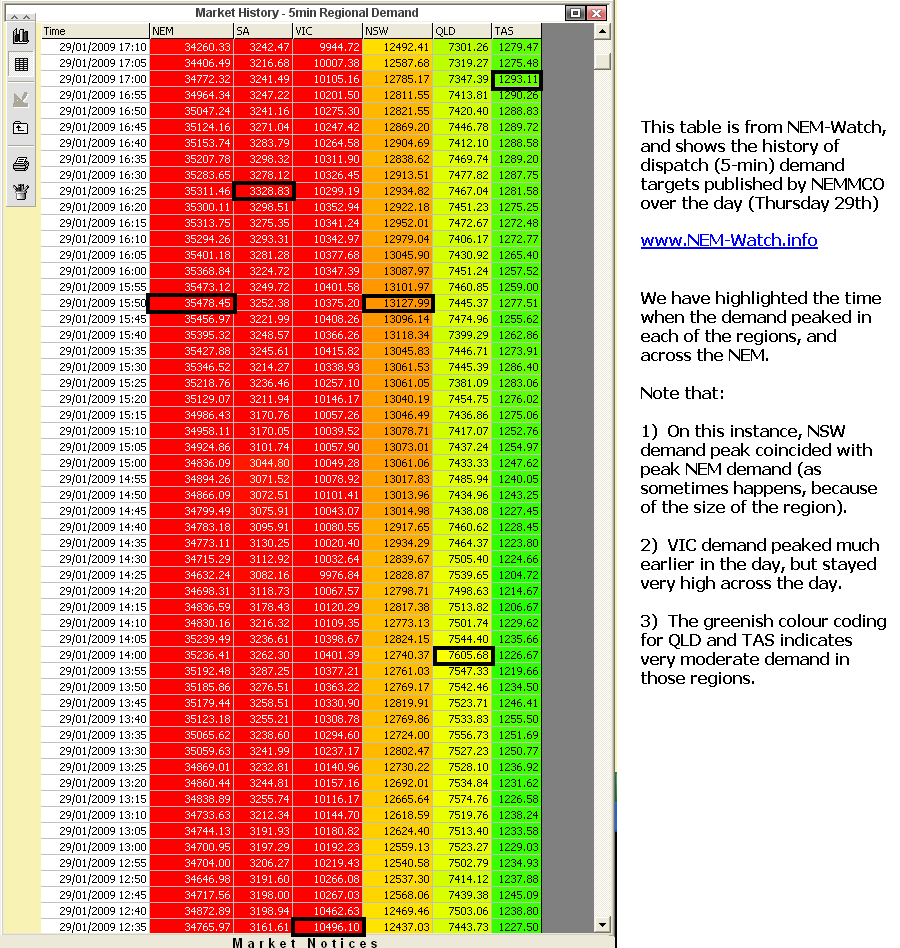
From this table, we can see that:
- On this day (as is typical in the NEM) the demand peaked at very different points in time for each of the regions shown. This is typically termed “diversity of demand”, and can also be used to describe the way demand peaks in QLD on a different day than in VIC, for instance, due to the different weather patterns across the country;
- By the colour coding (red being extreme) we can clearly see that demand was very high in VIC and SA, reasonably high in NSW, and much more moderate in QLD and TAS;
- We also see how the NEM-wide demand peaked simultaneously with the peak demand in NSW today. This is understandable, given:
- the fact that NSW demand is a significant percentage of overall NEM demand (37% at peak, this time); and
- the fact that VIC and SA were consistently high across much of the day.
The situation in the market at 15:50 is shown below, in a Market Snapshot taken from NEM-Watch v8 at the time:
Within NEM-Watch, it’s possible to configure alarms to do this automatically whenever significant events occur – we use this to build up an electronic library of market images.
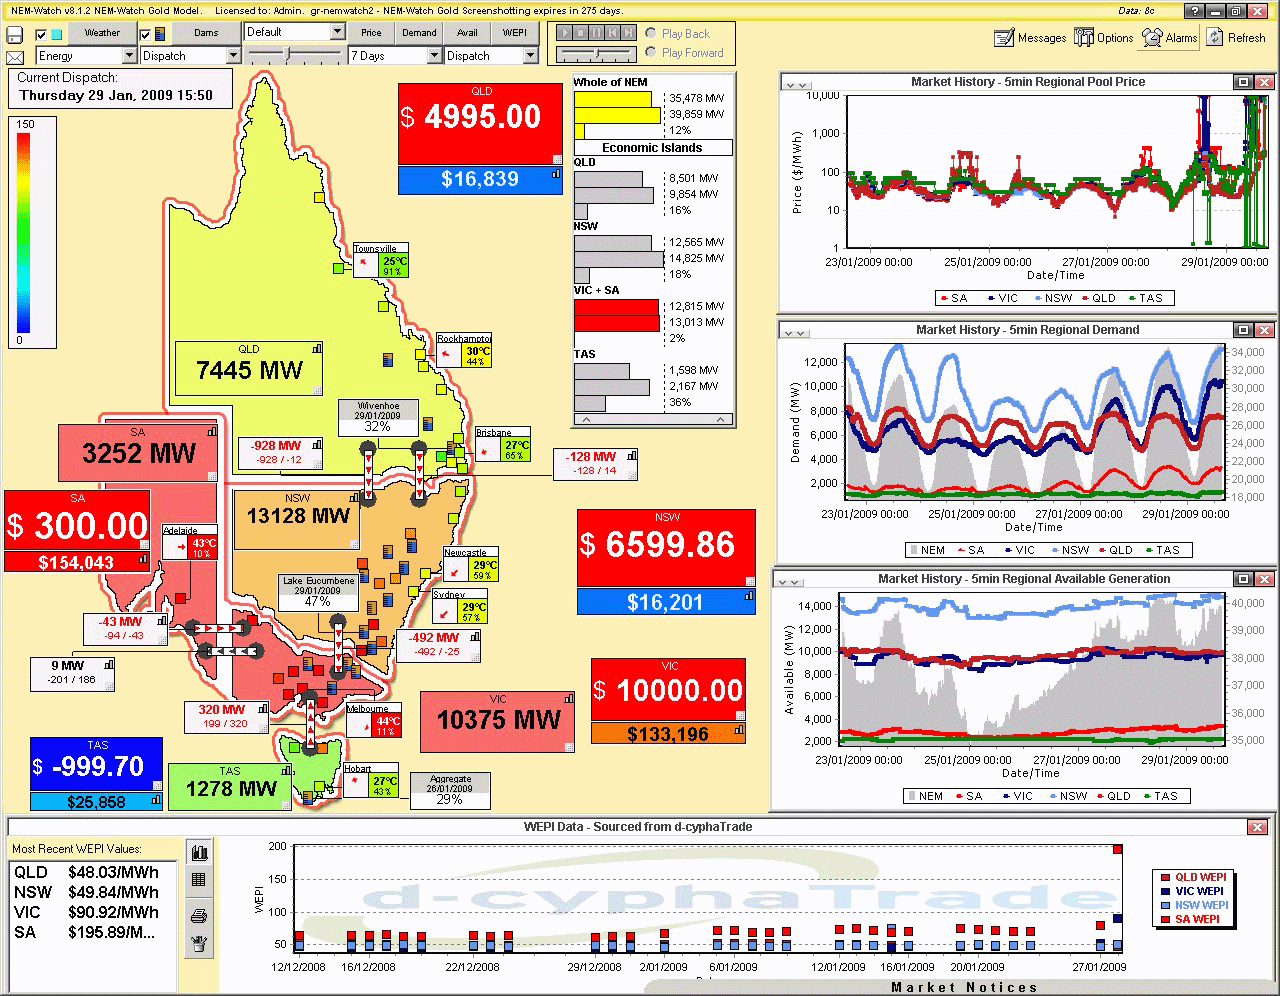
From this image, we can see a number of things:
- We can see the NEM-wide demand peaked at 35,478MW, which was:
- A full 635MW higher than the peak recorded the previous day. We presume that much of this was additional airconditioning, and other cooling related load in homes, businesses, and elsewhere that was not used (or used as much) the previous day.
- We also see that the demand was 1,186MW more than the previous peak demand, set on a very cold evening in July 2008;
- An absolutely massive 3,457MW of demand higher than the previous record summer demand – set in March 2008, when SA endured a major heatwave. That’s like finding a whole new city of Brisbane suddenly attached to the grid – one wonders what would have been the case had industry not started feeling the effects of the Global Credit Crunch.
- We also see (as we noted last night) that this demand easily beat (by at least 900MW) the forecasts provided to us by many market participants and observers. Hence it’s fair to say that this level of demand was not expected by too many!
- As noted in other articles, the red colour-coding of the VIC and SA regions clearly highlights how the demand in those regions was higher than the levels previously recorded (up until this summer).
- We can also see that the NEM-Wide Instantaneous Reserve Plant Margin (IRPM) dropped to a low of 12% (it’s coloured yellow in NEM-Watch to draw your attention to it). What this means is that:
- There was 4,381MW of “spare” generation capacity across the NEM, which was plenty;
- We noted in some analysis performed in June 2007 that the NEM had regularly reached, but rarely dropped below, 12% IRPM at times of tight supply-demand balance;
- However, much of this spare capacity was in QLD, NSW and TAS, and (because the interconnectors into VIC were constrained – shown as red in NEM-Watch) some of this capacity could not be used to meet demand;
- Our next observation, then, is that (as highlighted in red in NEM-Watch) the IRPM of the SA+VIC “Economic Island” (that existed at the time because of the constrained interconnectors) was very low:
- We can see that VIC+SA had a value of 12,815MW for demand minus imports (we call Local Net Demand);
- We can see that the available generation capacity within VIC+SA had a value of 13,013MW;
- The difference between these (198MW) was the amount of “spare” capacity available in VIC+SA to meet this “Local Net Demand” figure:
- This is how we derive an IRPM for VIC+SA of only 2%
- It assumes (which would at least be true, in a commercial sense) that VIC+SA could import no more power from either NSW or TAS at the time. In some instances, NEMMCO might call on the interconnector to carry more than its current constraint limit in flow, but this is not done in “normal” times.
- We see that the prices at this point in time were also high in most regions:
- We see VIC at $10,000/MWh, which is a price known as the Value of Lost Load (VOLL) and which is a level that is set (and reviewed periodically) by the Australian Energy Markets Commission (AEMC).
- We see QLD and NSW prices high as well – in one of only 2 dispatch (5-min) intervals over the day when this occurred in those regions;
- We see the price in SA at $300/MWh – which is the level of the price cap imposed by NEMMCO after the rolling 7-day Cumulative Price for SA (shown in NEM-Watch) reached the Cumulative Price Threshold (of $150,000/MWh). This is discussed more below…
- We also see a negative price in TAS, almost at the level of the negative price cap (-$1,000/MWh) – because of the large surplus of capacity that existed there, and due to the way Basslink has to be operated.
- Finally, the chart included in NEM-Watch “Market History – 5min Regional Pool Price” has been shown with a log scale in order that the wide range of prices experienced over the 7-day range selected (excluding those below $1/MWh) can be more clearly seen.
- As a final note, we also see that there was a significantly higher Wholesale Electricity Price Index (WEPI) recorded for SA yesterday ($200/MWh average over the entire day) – in the chart at the bottom of NEM-Watch.
We hope this explains a little of what was happening at the time when the NEM’s new NEM-Wide demand peak was set today!
NEMMCO released two notices during the day to state that the Cumulative Price Threshold (CPT) had been reached – firstly in SA and then in VIC.
The Cumulative Price is a measure of the rolling 7-day sum of the trading (30-minute) prices in the region to the current point in time.
In simple terms, once the CPT has been reached (currently $150,000/MWh), price caps are imposed to ensure that the price in the “offending” region does not rise above $300/MWh. The cap remains in place until the Cumulative Price has fallen again (but to a level I can’t recall, at present).
The only other time we can recall the CPT being reached was in March 2008, when an extended heatwave played havoc in SA. This was the event that prompted us to include a display of the Cumulative Price into NEM-Watch v8 (a few suggestions for improvement from clients did not hurt, either!)
We have included, below, a display of NEM-Watch at 15:35 showing the price cap in place in SA (i.e. price at $300/MWh) with the Cumulative Price shown to be $154,043/MWh.
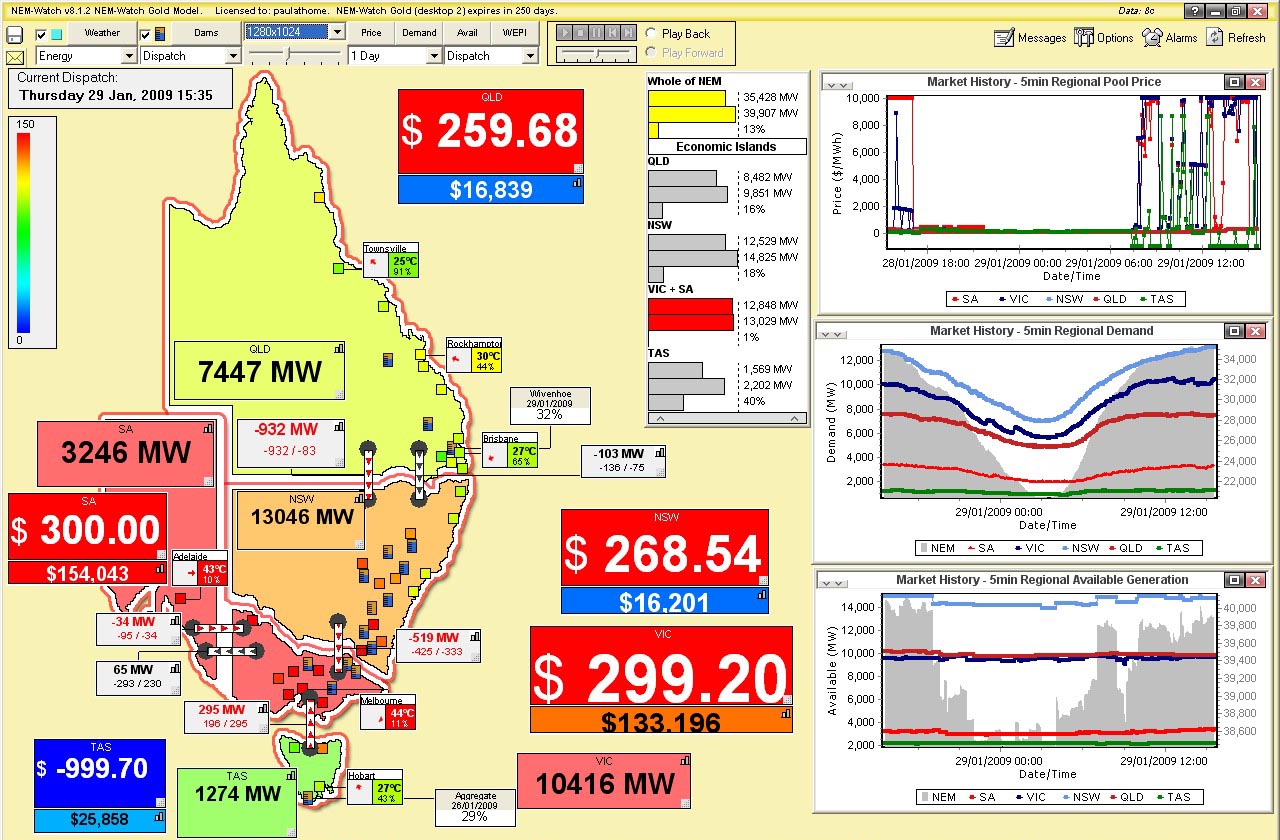
In contrast, see the more “normal” levels of Cumulative Price in NSW and QLD – i.e. a level of $16,000/MWh represents a time-weighted average price of about $47/MWh- which is generally seen to be around the long-run marginal cost of most generators.
The Cumulative Price in VIC is shown to be somewhat lower than in SA, but climbing (the price cap was imposed there a little later in the afternoon).
Keep in mind that the peak in demand was registered at 15:50 NEM time (NEMMCO works on Eastern Standard Time – no daylight savings – so all NEM data in NEM-Watch is shown in that time).
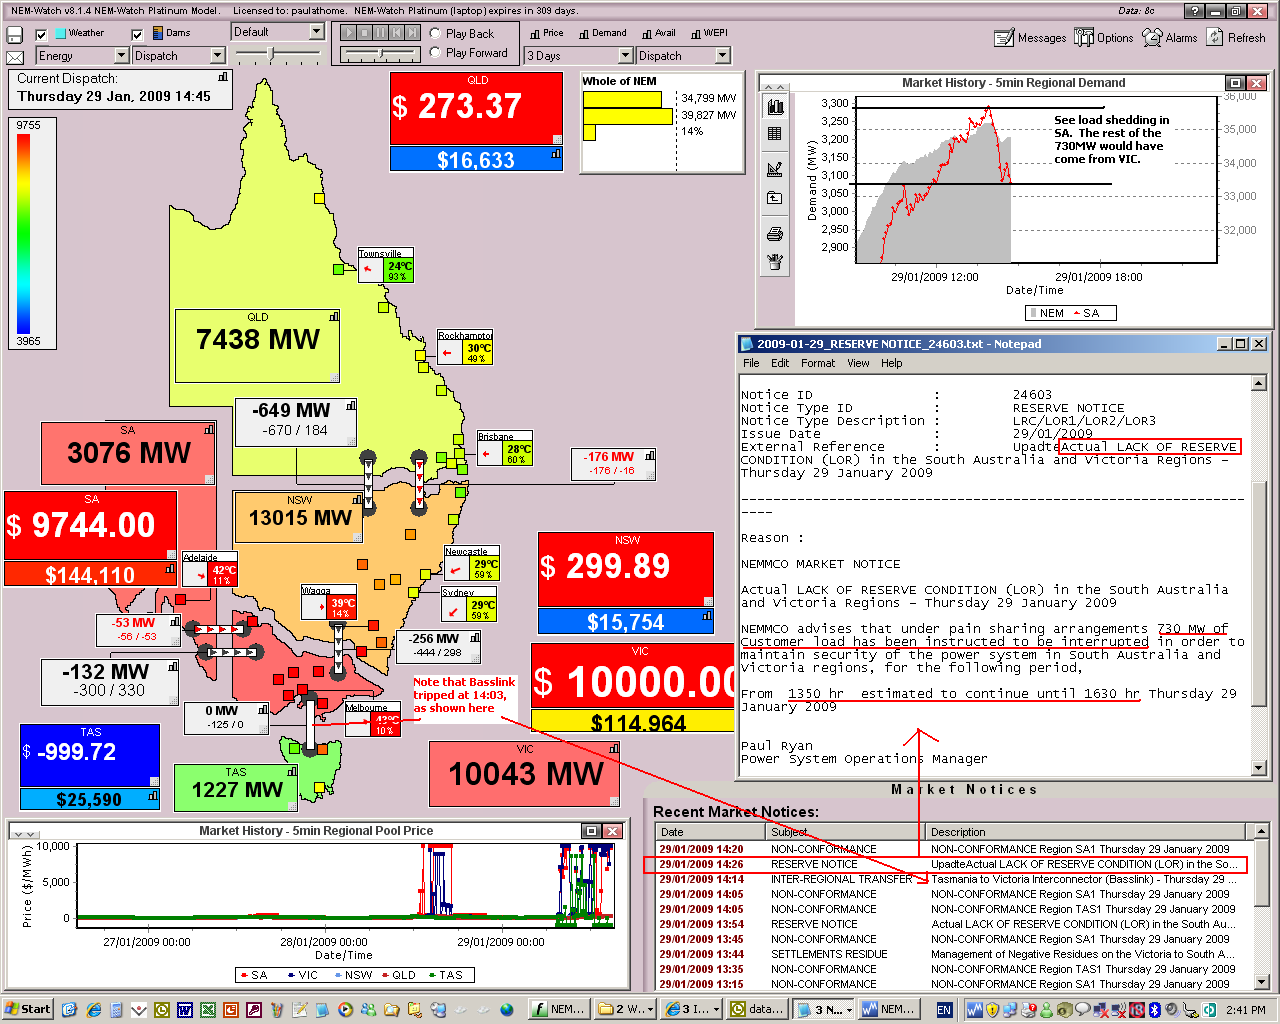
See the screenshot from NEM-Watch below that includes a NEMMCO Market Notice (which are basically NEMMCO’s “internal” communications to those organisations actually involved in the wholesale market – i.e. the generators and the wholesale market customers (retailers and a very few large energy users)).
This Market Notice informs the market that, from 13:50 (i.e. two hours before the peak in demand was recorded) they would be requiring 730MW of involuntary load shedding, with the “pain” to be shared across VIC and SA. Makes one wonder what the peak demand would have actually been without it!
In the snapshot taken from NEM-Watch, we see how demand in SA had dropped by about 200MW or so – meaning that the remainder would have come from VIC.
We were asked today “who would be turned off”? As we were quoted today as saying, we don’t know that for sure – as the arrangements are different from state to state, are confidential, and may change over time, too.
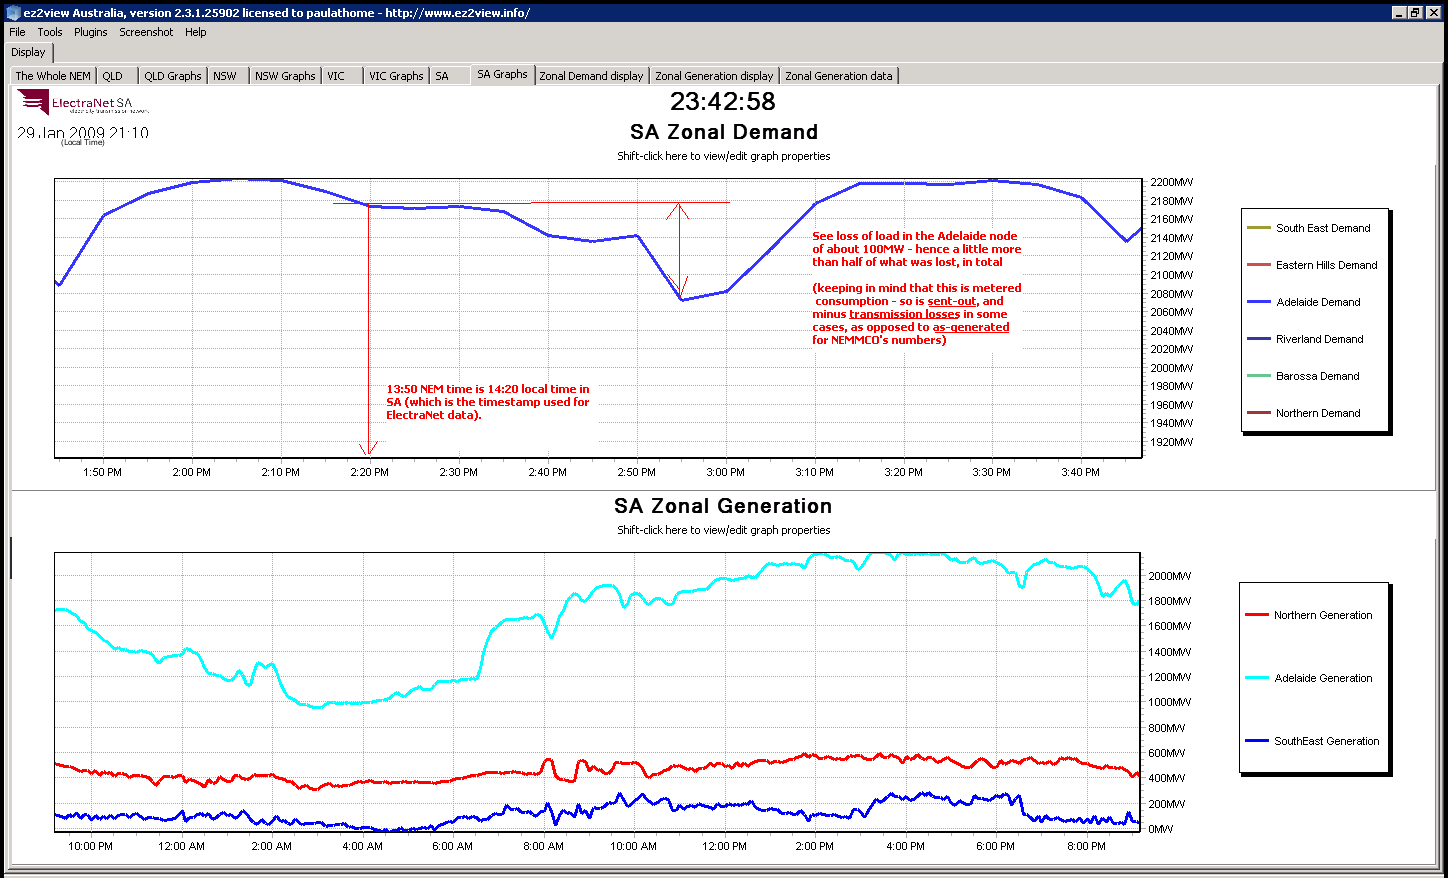
With reference from a different data set we have supplied to us by ElectraNet (transmission provider in SA), we see a dip in load within Adelaide that may have been related to the load shedding called for by NEMMCO.
See below another snapshot from NEM-Watch, highlighting no flow over the Basslink interconnector (between TAS and VIC) at 14:25.
As noted above, NEMMCO informed the market a little earlier (through another Market Notice) that Basslink had tripped at 14:03.
Whilst this occurred slightly after NEMMCO had commenced involuntary load shedding (noted at 13:50), it certainly would not have helped the situation, given VIC was importing power from Basslink just prior to its trip. This can be seen in the chart shown on NEM-Watch (below), launched from within the application.
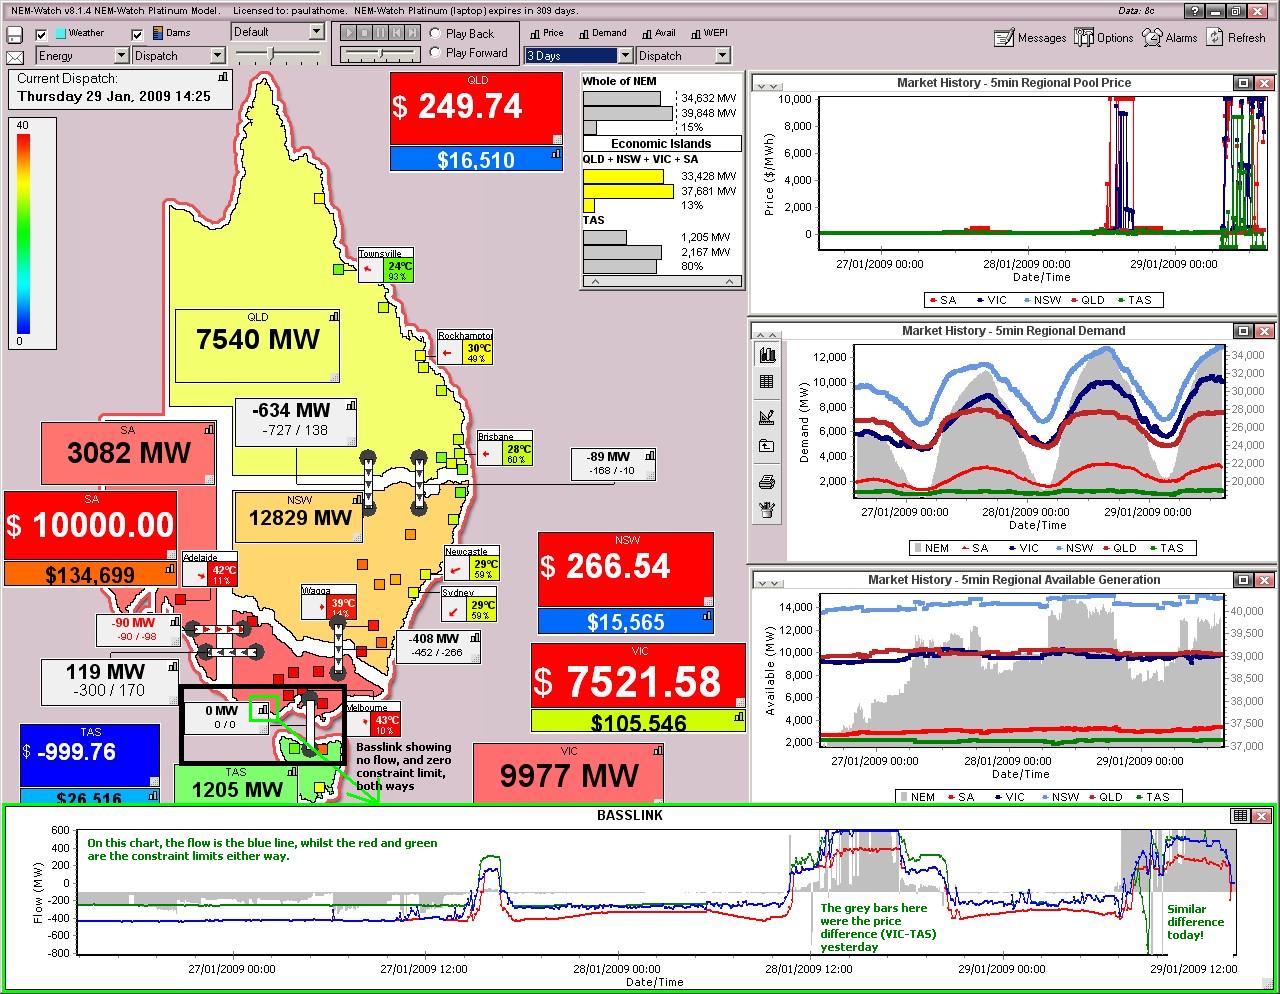
Positive flow on all interconnectors means flow to the North and West – hence we can see that Basslink was heavily exporting to VIC throughout the high priced periods today (Thursday 29th) and yesterday (Wednesday 28th) – whereas Basslink has typically been operating in the reverse direction for much of the past year, as Hydro Tasmania tries to use it to conserve its dwindling water supplies (because of the persistent drought).
It’s certainly far too early to be definitive – and there will certainly be many other (bigger) organisations who conduct much deeper (and more time-intensive) reviews than this short, “same day”, one here (as happened after the blackouts on 16th January 2007).
However the following are some initial observations…
The case, today, is also one that would seem to indicate a large benefit in a stronger interconnection capacity (i.e. there was a sizeable surplus of generation capacity that just could not be transmitted into VIC+SA because of transmission constraints on our “long and skinny” transmission system).
Back in March 2008, we also mentioned how this has proved difficult (impossible?) to implement a beefier transmission network, given the framework under which the NEM operates:
- It’s not the fault of the transmission companies, here, (we think) as we see that they want to upgrade the system – we’re not even sure a national transmission planner will help that much (but time will tell, as it’s on the way);
- The transmission companies are bound to follow the rules stipulated under a test called “The Regulatory Test” – I think we used the word “arcane” to describe the test back in March 2008, as it does seem that not many know what it entails.
- In a nutshell, it means:
- Any savings on cost that energy users would gain as a result of lower prices (from more competition) engineered by a stronger link cannot be considered – they are deemed “wealth transfers”, not “market benefits”;
- Generators effectively come first, in the test (which is fair, as they compete in the market, whereas transmission does not).
- However, what it means is that (because the whole process of a transmission upgrade takes many years to complete) it has the effect of recurrently postponing any transmission upgrades, as new generation capacity is committed.
- This works fine, most of the time (as the capacity is there to supply demand) except when transmission constraints occur, generators have local market power, and use it to force the price up – such as what happened in March 2008 in SA.
The Value of Lost Load (VOLL), as a concept, existed at least as early as 1990, which was around the time when the initial electricity market of England and Wales was started (my memory is a little vague of the exact date).
It is designed to reflect the average price all energy users would pay (up to) before being disconnected from the system at times of shortage of supply. The concept generally acknowledged that there would be a wide range of individual levels of VOLL (some a lot less, some a lot more) – however the level was generally deemed to be representative.
In “the Pool”, as it was called, there was also a term known as “Loss of Load Probability” (LOLP) which was used in tandem with VOLL in England & Wales to calculate some part of pricing – though my memory of how it worked is hazy as well.
In England and Wales (at market start) I vaguely recall that the level of VOLL was set at £2,500/MWh – which made it a bit of a coincidence that, when the market initially started in Australia (pre-NEM in Victoria 1994) the level of VOLL was adopted at $5,000/MWh.
Since that time, the level of VOLL in the NEM has been periodically reviewed by the NECA Reliability Panel (now the AEMC Reliability Panel), with the last review being in 2007 (I think).
In late 2001 or early 2002 (can’t recall the exact date, off hand) the level of VOLL was increased from $5,000/MWh to $10,000/MWh.
What is especially interesting (and important for the market) is that the level of VOLL is not just a defacto representation of the curtailment cost for energy users, it also serves as a price cap in the market – which is especially important given the NEM’s “energy only” design:
- Firstly, note that we generally support an energy-only market concept (for reasons too numerous to detail here);
- In an energy-only market, a generator does not receive capacity payments, so must recoup its entire cost base (short-run operational, and long-run capital) from payments it receives for its energy.
- Because, on the vast majority of occasions, pricing in the NEM generally follows the short-run marginal cost, all generators have a need to ensure that (at rare times of tight supply-demand balance) the price rises considerably – enough such that they can recoup their return on investment over a precious few hours in the year.
- Indeed, as we noted back in March 2008, generators sometimes adopt bidding behaviour described as “economic withholding of capacity” to force the price up when they have local market power.
- As we noted back in March 2008:
- This volatility is essential in an energy-only market,
- Generators will (and should) try to maximise their profit (it’s their choice whether they take a long-term or a short-term view);
- It’s not against the rules (nor should it be);
- Whether you “win” or “lose” depends on how you are contracted – not whether you are a generator, retailer, or energy user.
In this environment, it’s especially important to know that the level of VOLL is set “just right”:
- too high, and the volatility will cause loads of problems with cash flow, prudentials, etc…
- too low, and there won’t be sufficient incentive to allow for the development of active demand side response – which brings us to the next point…
As noted above, NEMMCO imposed a level of involuntary load shedding on the market today.
The electricity supply system that underpins the NEM is like one large, integrated machine.
Everything “spins” at 3000rpm – either mechanically (in terms of turbines and generators) or electrically at 50Hz. This is the same as is the case for about 1/2 the world (the other half is at 3600rpm).
If a new load draws power out at one end of the system, it acts like a brake, slowing the system down – whereas if a new generator injects power at the other end, the system speeds up. Acting together in a coordinated manner, the system stays at (or very close to) 50Hz.
This is important because, if the system were to overspeed (i.e. above 50Hz) or underspeed (below 50Hz) it would have potentially disastrous effects on expensive components (e.g. turbine blades could hit harmonic frequencies and fracture away from the turbine – which would be a very expensive and possibly very dangerous catastrophe).
To protect this from happening, the electricity system has numerous under-frequency and over-frequency protection systems in place. In simple terms:
- If the frequency looks like it is getting too low (which might happen if too much generation suddenly fell offline), then before the situation became critical, load would be shed to bring the system back into balance.
- Conversely, if the frequency looked like it was heading too high (which might happen if a large customer, like an aluminium smelter, fell offline) then generation might be reduced, again, before the situation became critical.
Basically, the speed & size of the response is determined by how quickly the frequency is changing (up or down). Some of this happens manually, some automatically.
The market operator (NEMMCO, in terms of the NEM) will always have an amount of capacity “up its sleeve” which it can call on to raise frequency or lower frequency, as the case may be. In the NEM, these FCAS services are generally supplied by generators (though not always) and are always sufficient to meet what is termed “the largest single contingency” – which basically means the single largest credible thing that could happen on the system (in terms of loss of supply, or demand).
It is when FCAS services are insufficient (for whatever reason), that load is shed (such as what happened today).
It appears to us (though NEMMCO will surely confirm later) that today we saw the demand grow to such a level that (because of constraints on interconnectors that meant not enough power could be imported into VIC+SA) NEMMCO had to invoke precautionary load shedding.
Essentially, to keep the system stable, NEMMCO needed to have the system “let off some steam” to avoid the risk of it slowing down and effectively stalling.
In this case, NEMMCO was required to direct the curtailment of certain sections of load in VIC and SA, according to certain protocols that had been determined in advance with the State Governments.
In many cases prior to the use of involuntary load shedding, some energy users will have voluntarily chosen to turn themselves off – generally in response to the price signal the market provides (i.e. the spot market price jumps when the supply/demand balance is tight).
In return, the energy users get some of the benefit of offering this service to the market – including (if they are large) an effect on reducing the market price for all.
There are many different permutations of how these arrangements can work – in general terms, it’s called Demand Side Response (in North America its more commonly called Demand Response – and the term “nega-watts” has been used increasingly, though we don’t particularly like that one). When we can find some time, we might detail more about this here.
One of those agitating for (some large users in) the demand side to be provided greater incentive to voluntarily shed load when supply/demand is tight is Roman Domanski (Executive Director of the Energy User’s Association of Australia) – even as recently as yesterday in this piece by Matthew Dunckley in the AFR “Power argument puts heat on Victoria”.
Another organisation which has taken a slightly different approach is Energy Response, which targets slightly smaller (though still large) customers and aggregates their responsiveness to offer as a hedge to a willing counterparty (maybe a generator or a retailer).
We know of another couple of companies who are currently trying to build a business around some form of aggregation – either aggregating demand side response, or aggregating the use of small back-up generators (such as in the basements of most city high-rises). We also know of some others who could not quite make it to commercialisation – a sign that it’s not an easy business to be in!
We’re also involved in working to facilitate an active demand side response in the NEM, as there are considerable benefits that some large energy users can gain (though it’s not for everyone).
We work with the EUAA and Energy Response (though we don’t always agree with their points of view about the market), and our other clients include large energy users in the steel, zinc, magnesia, cement, paper and water industries (to name a few). Each client has a slightly different permutation on their commercial arrangements, but all incorporate some element of spot price exposure – basically, they turn off consumption when the price is high and obtain a significantly lower average cost of energy overall, as a result.
As a general guide, 20% of the average cost of electricity over the year is made up of price spikes that occur 10-20 hours each year, such as today.
A key consideration with any of these types of voluntary arrangement is the level of firmness – basically, how sure is NEMMCO (or your other customer) that you will actually turn off when you are meant to? If their confidence is not great, you’ll be classed as “non-firm” and the value of your response (as an insurance policy) will be much lower than if you were considered “firm”.
This is perhaps one of the most significant stumbling blocks to the more widespread adoption of demand side response – in some cases, some energy users want to “have their cake (gain a large benefit) and eat it too (be able to decided IF they turn off or not, when called)”.
As a final note, it’s quite a remarkable coincidence that the AEMC would choose today (of all days) to publicise (on it’s What’s New page) the fact that it has published a notice regarding increasing the requirements and incentives for use of Demand Management in the NEM.
Their website references more detail here about the making of a draft Rule determination – we have not read, as yet!
We hope that this proves helpful to you – one more way we’re seeking to make the market understandable, to a wide range of people?
It turned out to be pretty long-winded (much longer than a normal “blog” post) and I’m off to bed now as “tomorrow” (today) will be another hot day.
Feel free to leave comments, criticisms (we freely acknowledge we’re not experts – just geeks who watch the market), and suggestions.
From the Herald Sun website:
“National Electricity Market Management Company spokesman Paul Bird could not say exactly how many homes were affected.
“We instructed the transmission companies in Victoria to reduce the load because of that unusual event,” he said.
Energy and Resources Minister Peter Batchelor said electricity supply was “very tight” but there was “just sufficient power” to get by.
“Subject to no major plant failures and other catastrophic interruptions, we think we’ll get through today, the tightest of all days,” Mr Batchelor said.”
This is a conflict of information with what you have reported – does this mean that the media is covering up the fact that load was shed before basslink tripped due to the lack of reserve?”
Hi Kieran,
Thanks for your excellent question.
We’re still pondering this one, to try to work it out. What we can see from the NEM-Watch snapshot included above is that:
1) The Market Notice about Basslink trip was published at 14:14 (i.e. first) and the LOR load shedding in SA at 14:26 – both of these times are NEM times, we believe.
2) The Market Notice itself refers to load shedding starting at 13:50 (i.e. half hour beforehand). We thought that this may have been a local time in SA, but that does not make sense, either, as SA is ahead of NEM time by 30 minutes in summer.
3) We can also see (snapshot not included) that the load started dropping in SA at 14:00 and that this continued to 15:00 (NEM time).
4) In total there was a reduction of 200MW or so – so it is possible that some of this was not the INVOLUNTARY curtailment, and might have just been a coincident outage in ETSA’s distribution system, which was under strain all day.
Hence we’re not sure what the situation was …
Paul
Thanks for your excellent analysis of NEM spot market behaviour. It would be even more worthwhile if you could complement this with information and discussion about related derivative trading.
Hugh
Hugh,
Of course you are aware that the derivatives tend to trade on a quarterly basis for forward exposures, not in real-time along with spot market events.
d-cyphaTrade provide a comprehensive weekly market wrap of futures activity on their website (http://d-cyphatrade.com.au/market_wrap).
Joe
Hugh,
Apologies for the slow response.
We realise that the wholesale market is only 1/2 of the puzzle, and are working on ways in which we can shed more light on the operation of financial market trading (both OTC and ASX), but are not at a position where we can say much more yet.
Cheers
Paul