
As noted here on this main page, the Generator Report Card (our 20-year review with data to 31st December 2018) has been developed with a number of different parts, or sections – including (in Part 5) a lengthy Glossary of terms used in the analytical process, and in the report card.
The order form for your copy is here.
Inside the Glossary, we explain (amongst other things) the Metrics used to assess a range of different aspects of performance of the generators over up to 20 years of NEM history. Dozens of different Metrics have been identified and are being progressively compiled for inclusion in the Generator Report Card:
1) Some were included in trended raw form in Part 3 (Results by DUID) of the Generator Report Card
2) Others were analysed for the discussion included in Part 2 (Key Insights) and in Part 4 (Results by Aggregation).
3) As the Metrics were identified, and added to the Glossary, they were assigned their own ID number for internal purposes.
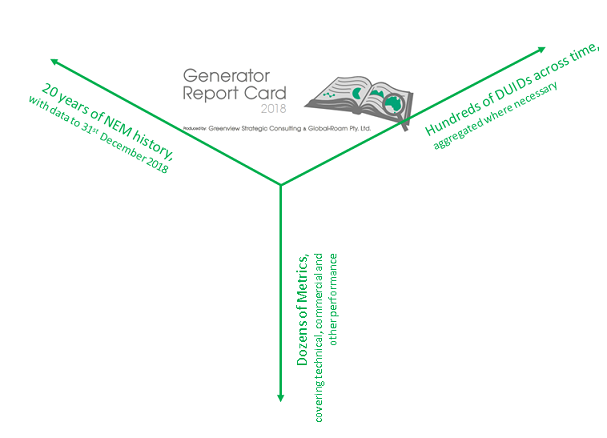
The following diagram has been drawn to convey the large scale of the project that has been undertaken across 3 dimensions:
From time to time we have discussed some particular Metrics within more regular articles on WattClarity site. As time permitted (and if we remembered to do so) we have linked them in to the following table:
(note that we have added the Metric number in here for our future reference – it’s probably not going to be too much use to you, other than to help you understand the number of metrics we’ve identified)
| (#) and Metric Name | Discussion for this metric on WattClarity ® |
| (1) Energy-Constrained Generator Availability | Availability data is used in many articles throughout WattClarity. In the Generator Report Card, we’re taking a long-range view (not quite 20 years, as data was not published at the start of the NEM) to see what has been changing over time, and how significantly.
On 7th February 2019, AGL Energy provided it’s 2019 half-year results, including a note about the availability of its aggregated portfolio. Given we were working on the Availability Metric at the time, we posted this view of availability at its three main thermal assets – Loy Yang A, Bayswater and Liddell. This same availability data was translated into an unavailability metric (with reference to each unit’s Registered Capacity in each dispatch interval) to provide a trended view of aggregate unavailability across 48x operational coal units across the NEM as at 31st December 2018. Some of what we did in the Generator Report Card was discussed in this article published on 14th June. |
| (17) Marginal Loss Factor (MLF) | A Marginal Loss Factor (MLF) represents the AEMO’s calculations of the average marginal losses expected from the point of generation to the relevant Regional Reverence Node. This is used in calculation of Spot Revenues.
Back in July 2018, we posted this article exploring the surprise expressed by a range of people when confronted with significant changes in their MLF from one year to the next – which, if the loss factor had dropped, directly represented a significant drop in top-line spot revenue figures. In his “Lessons from the trenches” article from September 2018, Jonathon Dyson notes (about MLFs) that:
In March 2019 we again see surprise expressed when MLFs drop as a result of more generation crowding into oversupplied areas remote from the customer. In response to this, we posted this article. It’s for this reason that we are investing considerable time in the exploration of MLF for all power stations over a 20-year period. |
| (20) Generator Off-Target | On 7th January 2019 we posted this article that flagged how we were conducting detailed analysis (for every DUID across all Dispatch Intervals they were operational for) to identify which generators had been significantly Off-Target.
This is one of the metrics that are useful in understanding which generators are more dependable than others in their output. We flagged that units might be Off-Target for a number of reasons, including: We also mentioned the tabulated list of “worst performers” in this article on 7th March. |
| (26) Actual Output, in MW | Naturally, the Generator Report Card will contain much analysis of actual levels of Actual Output – including the trend of ranges in output over time. |
| (27) Production (As Generated), in MWh | Naturally, the Generator Report Card will contain much analysis of actual levels of Production – including the trend of ranges in output over time. |
| (29) Number of Rebids in Total | On 13th February 2019, we posted this article highlighting preliminary analysis of a trend of total number of rebids across all DUIDs in the NEM. |
| (34) Number of Rebids Not Well Formed | As part of that same article highlighting overall number of bids we took a look at AER’s revised version of the “Rebidding and Technical Parameters Guideline” to categorize all rebids under three general categories:
Category 1 = “Well Formed”, applying a strict interpretation of the AER Guidelines Category 2 = Not in Category 1, but “Well Formed”, if applying a looser interpretation of the AER Guidelines Category 3 = “Not Well Formed”, even with a looser interpretation of the We posted some preliminary analysis that suggested a non-trivial number of rebids still “Not Well Formed” . In the Generator Report Card, we are taking this analysis further. |
| (48) Number of Starts | As part of the analytical process leading supporting the Generator Report Card, we have identified all occasions when every DUID in the NEM started (i.e. increased Actual Output from 0MW to something positive). We’ve done this for a number of reasons, including the following:
1) It can help us understand changes in patterns of operations for the grid/market as a whole – as discussed in this article on 7th March about “the death of baseload and rise of cycling”. 2) At a more micro level, as well, it can help us understand degradation patterns and trends – hence being able to understand for every single generator: |
| (59) Hours for which Connection Point Subject to Bound Constraint | In this article on 1st January (which also flagged the commencement of detailed analysis) we flagged some preliminary results that indicated that there were up to 200 DUIDs at connection points affected by constraints in any given months. This showed a percentage of DUIDs affected between 30% and 50% each month.
For clarity, note that the specific DUIDs affected will vary from one month to the next, depending on the specifics of the constraint equations that have bound. It’s for this reason that we have invested time in exploring constraints and their affect on generators (at both macro and micro levels) within the Generator Report Card. |
| (60) RRP Price Contribution | Using an extensive history of the AEMO’s Published Price Setter files, we will
On 28th February, we published this “Intermediate Guide to how Prices are Set” from on 28th February, to help explain some of the complexities inherent in the price setting process – and gues author Allan O’Neil followed up with this additional conceptual explanation on 22nd March 2019. Because of these complexities we are exploring several different methods for providing a longitudinal answer to the question that is being increasingly asked “who’s set the price?” As the this article helps to explain, this is not as simple to answer as it might initially seem. |
| (72) Possible Trip – Method 2 (AEMO Logic) | Power station technical performance is of great interest to many people – hence the effort we’ve invested in the Generator Report Card. One of the technical parameters of interest is reliability and, as a subset of this, the number of trips.
On February 13th the AEMO published its “Quarterly Energy Dynamics – Q4 2018” (the PDF is here). In particular this report noted that:
In this particular report, the AEMO defines a “sudden trip” as:
We’re taking this definition and having a look at what the performance has been, using this metric, over the longer-term. —— Note that identifying trips is not as easy as it might initially seem when scanning over 20 years of data for hundreds of DUIDs. There are a number of different algorithms that might be coded to produce a result – but (to date) none have proven themselves to be of high enough accuracy for us to be perfectly comfortable. |
| (67) Instantaneous Reserve Plant Margin (IRPM) | The very tight supply/demand balance experienced across Victoria and South Australia on Thursday 24th and Friday 25th January attracted much commentary, including here on WattClarity.
In this particular article reviewing what happened on 24th January the Instantaneous Reserve Plant Margin (IRPM) metric that’s been featured in NEMwatch for a number of years was featured – and proved a very useful non-price indicator of the balance between supply and demand. It’s for the same reason we’re trending distributions of IRPM* over time as a macro indicator of the balance between supply and demand to provide some context to the more detailed analysis. * In the Generator Report Card, we calculated this slightly differently, as a Dispatchable Reserve Margin (DRM). |
| (N) Degradation of performance at high temperatures | On 18th April, we posted this article with an image of a “Mystery DUID” (along with a challenge question) that had been identified as one of the ones suffering a degradation in performance at high temperatures.
In the Generator Report Card, we take a look at all types of generators, to see how high temperatures affect their ability to achieve peak output levels. Judging by the responses that we received for our challenge question, there were quite a few people not thinking holistically about the temperature limitations of all types of plant. On 26th June we posted this follow-on article to shed more light on which unit “could not stand the heat”. |
| (N) Other weather effects | Earlier (on 1st April) we posted this article speaking about an increasing number of different ways our weather, and climate, is affecting the NEM.
In the Generator Report Card, we explore this further. |
| (N) Capacity Factor | On Thursday 27th June Jonathon Dyson posted this article following his presentation at the Solar Asset Management conference.
The presentation (and the article) featured some data presented in the Report Card about Capacity Factors achieved for solar farms in the NEM, with both: |
As other articles are added to the Wattclarity site that feature certain analysis included in the Generator Report Card, we will (as time permits, and it we remember) endeavour to link them in here.
Don’t forget that you can organise your access today with this order form.