
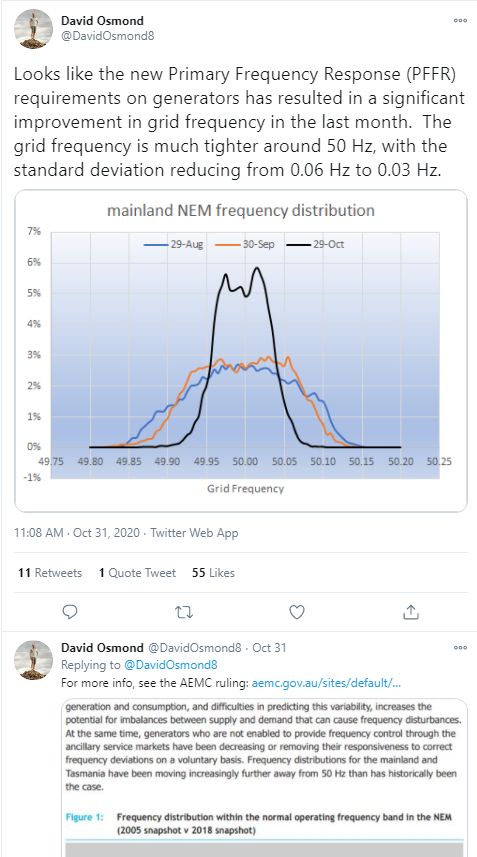
Paul McArdle recently drew my attention to a short Twitter thread started by David Osmond on the arcane topic of NEM system frequency behaviour:
At Paul’s invitation I’ve dived further into this issue to fill in some background, provide additional data, and comment on why it’s important – something others have been doing here on WattClarity and elsewhere for a lot longer than I have!
Some key takeaways from this piece are that:
- Frequency in an AC power system is a real-time measure of supply-demand balance, as well as a vital co-ordinating “heartbeat” for the grid. Its behaviour reflects the degree of real time control that the system operator is able to exercise over the supply-demand balance.
- Frequency control is one important indicator of the health of the power system, and has concerned many NEM observers and stakeholders in recent years, as frequency control performance significantly deteriorated.
- Poor frequency control increases the risk of bad outcomes following a major system disturbance. If the system experiences a shock when already off-balance –with frequency near the edge of its acceptable range – critical corrective actions have less time to operate and may need to be larger than would be the case if frequency had been better controlled beforehand.
- The NEM’s market-based Frequency Control Ancillary Services (FCAS) are a suite of mechanisms broadly designed to steer the system towards its target frequency level of 50 Hz, and to secure it after sudden large swings in frequency caused by unexpected tripping of a large generator, load, or interconnection. However FCAS in the NEM do not provide fine-grained automatic responses to smaller frequency shifts, and the market framework may have unwittingly contributed to deteriorating “everyday” frequency control.
- Following a rule change request lodged by Dr Peter Sokolowski in May 2019, which also highlighted the concerns of a number of experienced engineers including WattClarity guest author Kate Summers, the AEMC recently made new market rules requiring all NEM generators to progressively provide “Primary Frequency Response” (PFR), through automated reactions to system frequency deviations aimed at resisting even small movements away from the nominal 50 Hz standard.
- Over October this year as PFR implementation has commenced, significant improvements in NEM frequency control can be seen through analysis of AEMO’s 4-second “causer pays” operational data set, as in David Osmond’s chart above. This indicates that progressively more NEM generators are activating PFR, and that PFR parameters are being “tuned” to deliver tighter control of NEM frequency.
The role of system frequency
In large scale alternating current (AC) power grids, system frequency is both a key indicator of supply-demand balance, and a vital coordinating signal for the many interacting components dispersed around the large geographic span of the complex grid machine.
Until relatively recently, large scale generators on grids spanned by AC transmission have been almost exclusively synchronous, meaning they rotate at speeds electromechanically phase locked to the common system frequency (50 Hz in the NEM and other grids in Australia, 60 Hz in some overseas jurisdictions – Japan even has both on its main island!). 50 Hz is 50 cycles per second, or 3,000 RPM, and that is the exact speed at which all the NEM’s coal and gas-fired generators spin when online, assuming system frequency is exactly 50 Hz. (Hydro generators are subtly different and spin at a whole number fraction of 3,000 RPM. But they are also phase locked to the grid frequency.)
The elegant simplicity of this mechanism is that if supply starts to marginally exceed demand, the excess energy is absorbed by slightly speeding up all the rotating machinery – predominantly generators – which is phase locked to the grid frequency. Frequency therefore starts to rise, and would continue to do so unless the supply-demand imbalance is corrected.
[The rate at which frequency and rotational speeds rise obviously depends on the size of the energy imbalance but also on the inertia of the rotating machines – their resistance to a change in speed, being a function of how much energy is absorbed in accelerating their spin by a given amount. A feature of newer “inverter-connected” generation like solar and wind is that it does not naturally provide this inertia – but that’s a topic outside this article’s scope.]
Similarly, if demand starts to marginally exceed supply, the extra energy needed is drawn from the slowing down of the phase-locked rotating machines struggling to meet the extra demand (think of a truck slowing as it moves from a flat to slightly inclined road).
It’s important to emphasise that these inertial changes in speed, frequency and energy stem from the basic physical properties of the synchronous grid and its component rotating machines, not from deliberate or automated control actions. It’s equally important to understand that inertial responses simply “buy time” for active control actions to correct the underlying imbalance (think of the driver increasing engine power when the truck begins to slow on the incline).
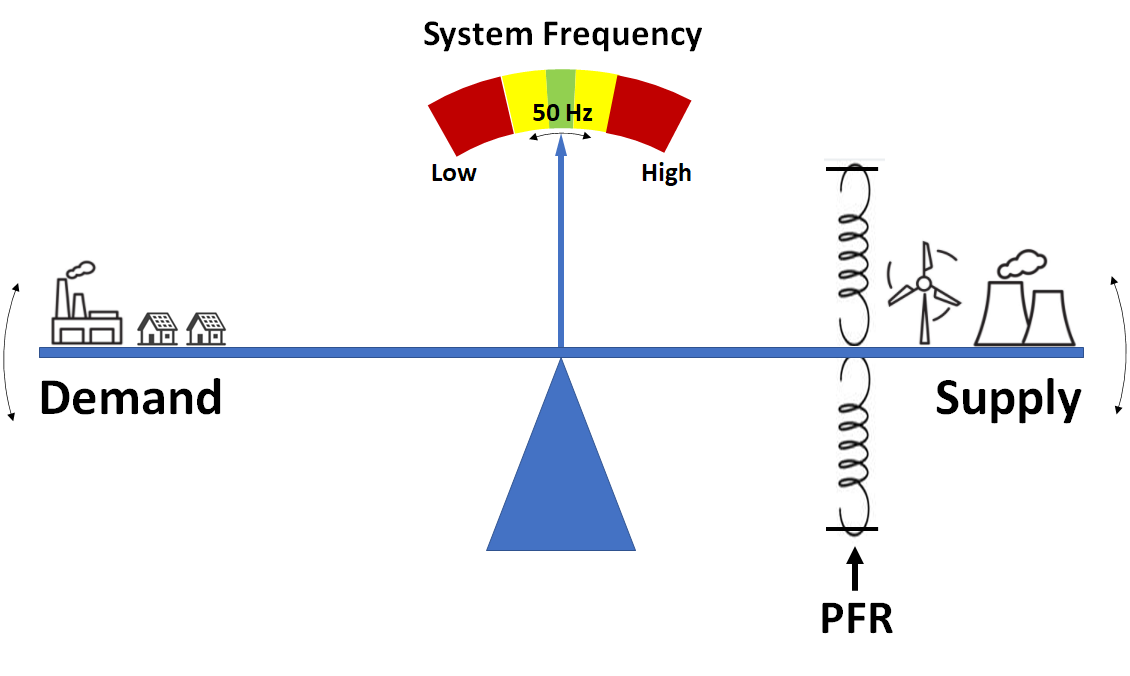
With that quick background on synchronous grids, it might be helpful to visualize supply-demand balance and system frequency behaviour using a different analogy – that of a “see-saw”:
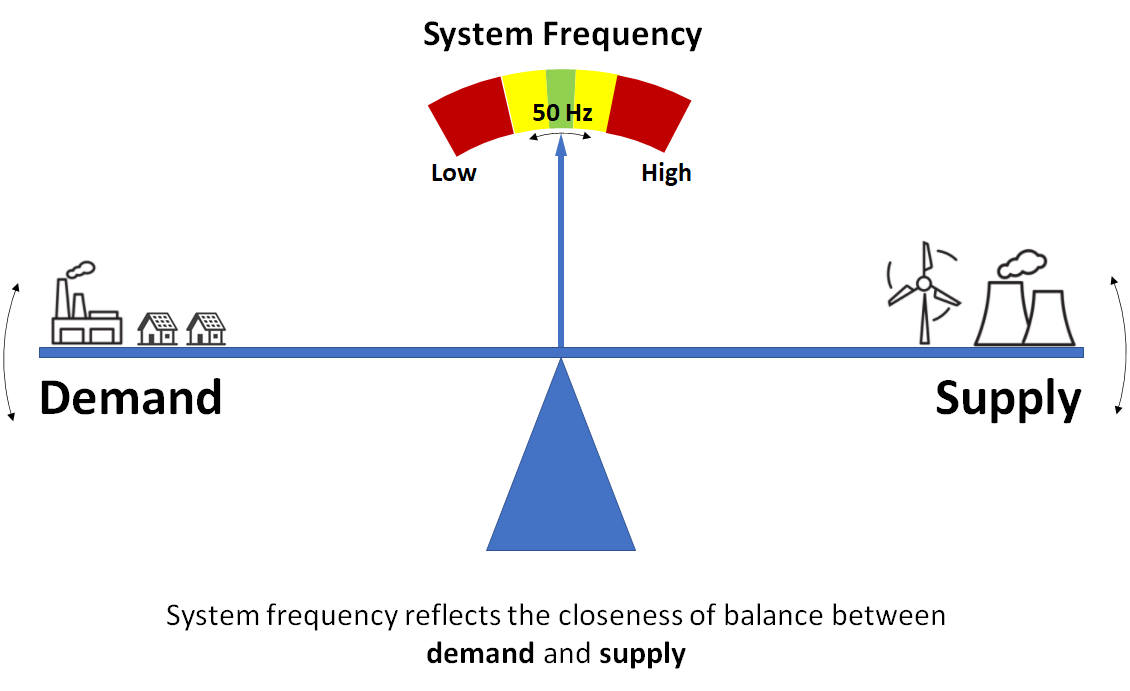
This analogy illustrates demand and supply perfectly balancing, with a level see-saw and the needle vertical at 50 Hz on the “frequency dial”. An excess of demand tilts the see-saw down at the left and swings the frequency needle to something below 50 Hz. An excess of supply swings the see-saw and the needle the other way. The continual challenge in operation of the grid is to keep the see-saw poised as near level as possible, frequency at 50 Hz, and to avoid time in the “red zones” where imbalances get harder to control and pull back from disaster.
The beauty of this mechanism is that it’s unnecessary to measure all sources of supply and demand to work out whether there’s any imbalance – changes in grid frequency show this immediately, and also signal its size. This allows some control actions to be initiated locally based simply on grid frequency, which changes in a spatially uniform way across the entire AC grid regardless of where supply or demand might be changing.
Keen observers will notice I haven’t shown an overall scale on the frequency dial, but the “to be avoided if possible” red zones for the NEM begin not very far at all from 50 Hz – usually just +/- 0.15 Hz (ie +/- 0.3%) either side of target – the NEM is a finely balanced machine and should frequency get much under 49 Hz or much over 51 Hz, partial loss of supply or worse can be expected.
System Frequency performance – then and now
To get an idea of how level the see-saw stays in practice, here’s a chart tracing NEM mainland system frequency every four seconds for a random few hours on 1 May this year:
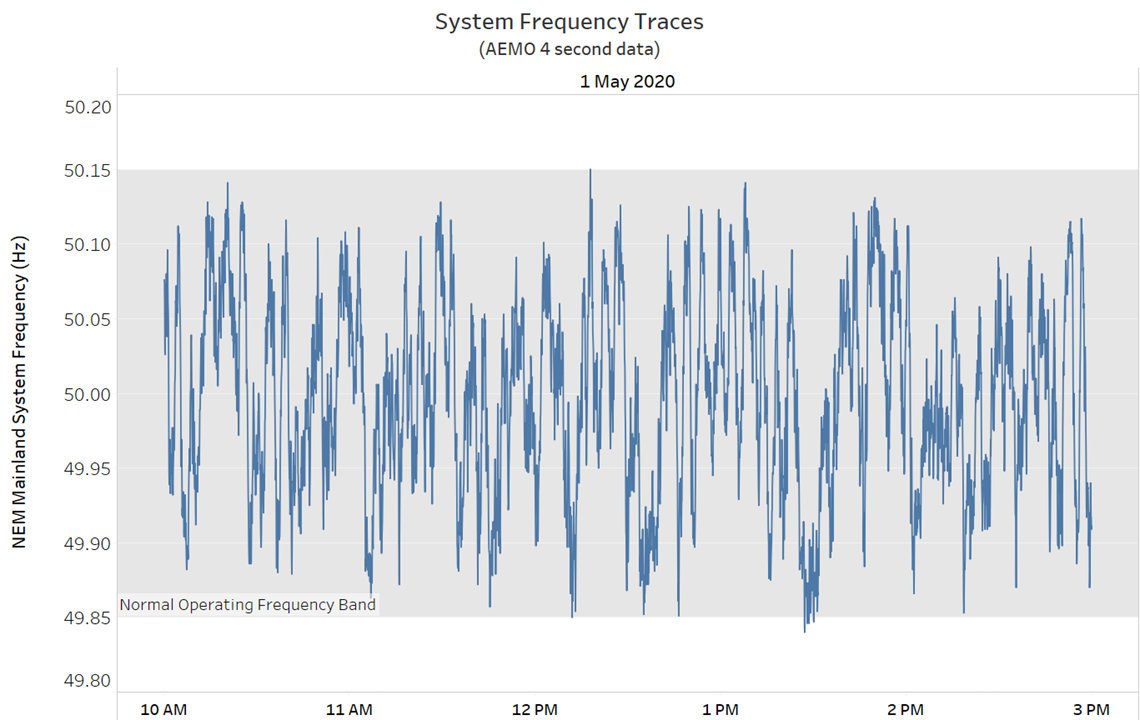
The extent to which frequency “wanders” around within the NEM’s Normal Operating Frequency band of 50 +/- 0.15 Hz looks a little disconcerting. We can get a higher level view of how much wandering the frequency does over a day by charting its distribution – the proportion of time the frequency is observed at different levels arranged lowest to highest, across the entire day. Here’s that distribution for all 21,600 readings taken at 4 second intervals on 1 May this year and reported by AEMO in its Causer Pays dataset:
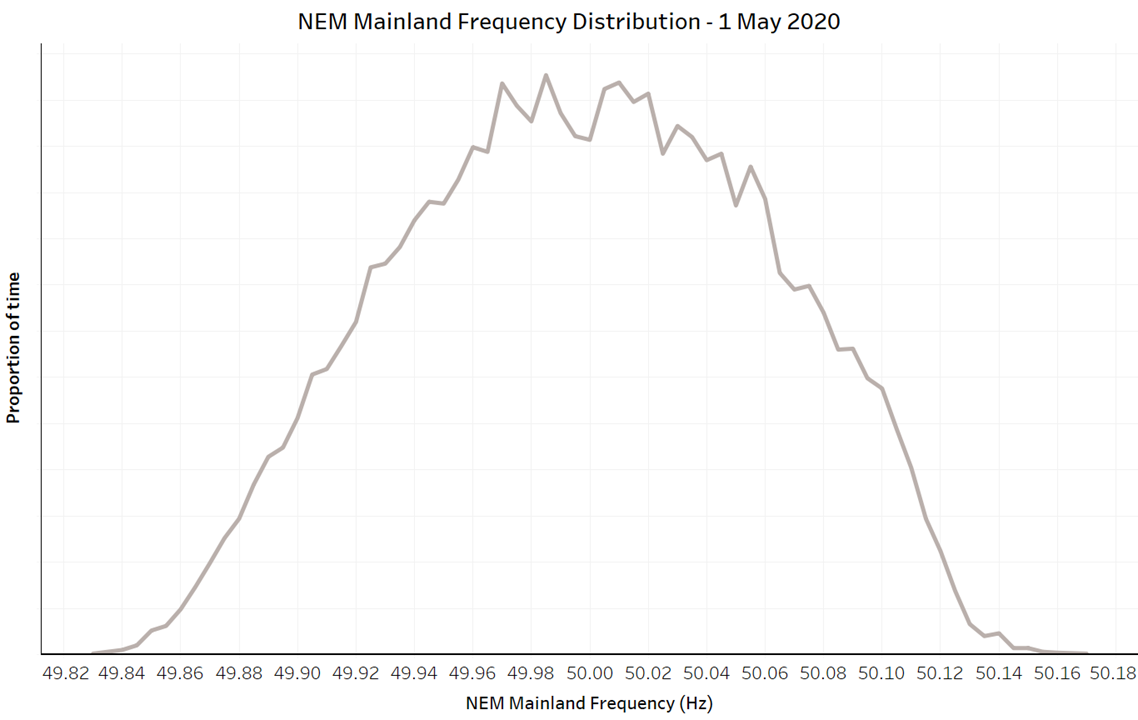
While this shows that most of the time the frequency was within +/- 0.1 Hz of 50 Hz, there was still a significant proportion of readings not far from the edges of the “red zone” at +/- 0.15 Hz.
We can compare this distribution with a day back in October 2018, to see if things were any better or worse a couple of years previously:
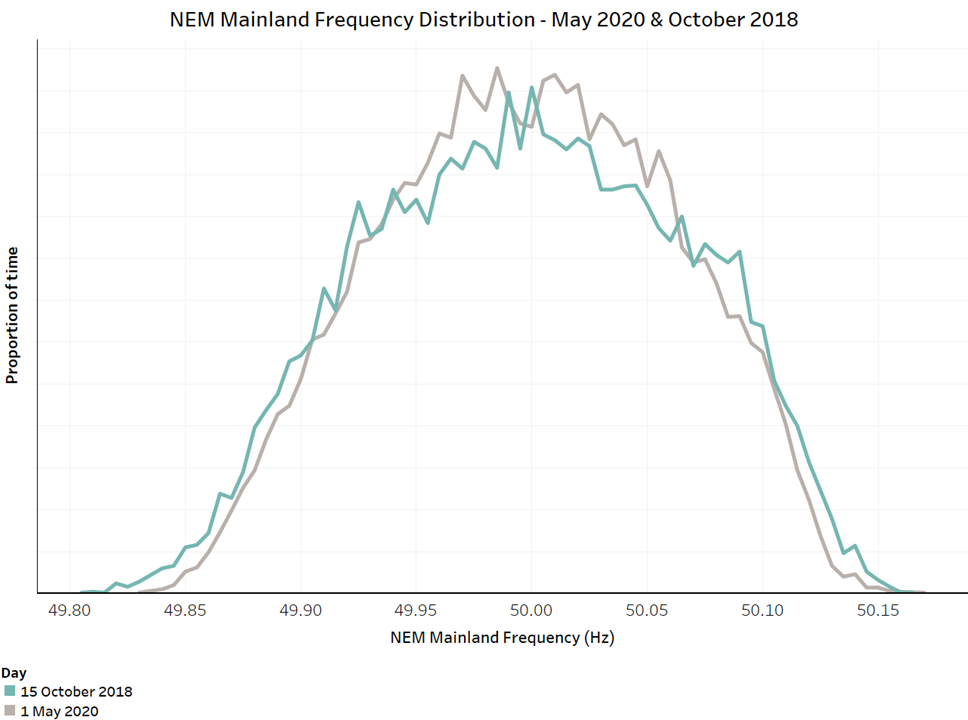
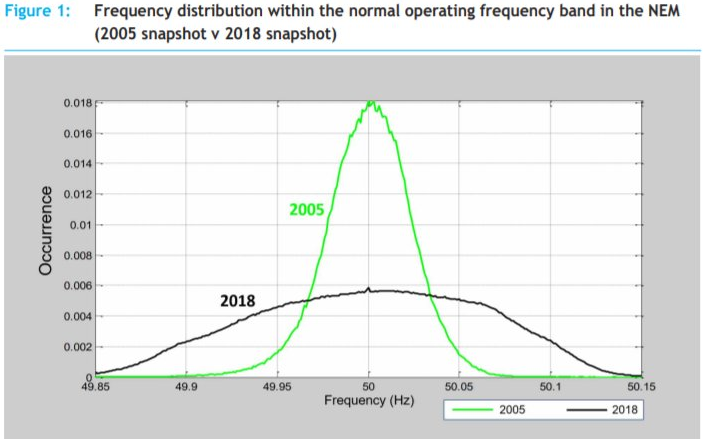
This implies that frequency control performance earlier this year was no better than it had been a couple of years ago, when this issue started receiving more attention. An AEMC chart also included by David Osmond in a tweet followup shows that across all of 2018, frequency control was even more wayward than on the single day I picked out from October 2018 but, more tellingly, highlights how much it has deteriorated since 2005 when frequency was far more tightly distributed around 50 Hz than in any recent observations, with hardly any readings outside 50 +/- 0.07-0.08 Hz:
Why the deterioration in frequency control – don’t we have FCAS for that?
The detailed reasons for the clearly observed deterioration in NEM frequency control since 2005 are outside the scope of this post. Some of them are discussed in articles on WattClarity by Kate Summers which also contain a trove of valuable insight into the problems caused by poor control of frequency.
Ironically, one possible reason advanced by some observers is that financial incentives created by the NEM’s market Frequency Control Ancillary Services (FCAS) framework may have caused many NEM generators to disable mechanisms that would normally act to improve overall frequency control, either because generators were not being explicitly paid for maintaining and operating these mechanisms, or because their operation led to higher market costs for their owners.
The market FCAS mechanisms fall into two subsets, one set designed to gradually steer (or “regulate”) the system towards its target frequency level of 50 Hz, the other to secure it after relatively large swings in frequency driven by sudden supply-demand imbalances following “contingencies” such as unexpected tripping of a large generator, load, or interconnection.
These contingency FCAS mechanisms deal with excursions outside the Normal Operating Frequency band (+/-0.15 Hz) but do little or nothing to manage “frequency wandering” within that band (think of these as “safety buffers” trying to limit large swings of the frequency see-saw).
And the evidence shows that regulation FCAS, centrally controlled by AEMO systems, has proved insufficiently nimble to hold frequency in the tight band around 50 Hz seen in the 2005 data. Regulation FCAS aims to steer the system towards an average of 50Hz by sending signals to certain generators to nudge their output up or down, but relying on a centrally managed feedback loop it involves time delays which limit its effectiveness at the fine-grained real time control level. Something else is needed to stabilize the frequency see-saw against the smallish shifts and wanderings caused by myriad second-to-second changes in supply and demand. Enter PFR.
Primary Frequency Response
PFR is nothing new, in fact it’s one of the older mechanisms used over the years to manage frequency on AC grids. The basic idea is simple – individual generator control systems are set to respond locally to low frequency by increasing steam, fuel or water inputs so as to increase power output (providing a countervailing push on the frequency see-saw), and to high frequency by reducing power output. The classic example is the Watt centrifugal steam governor:
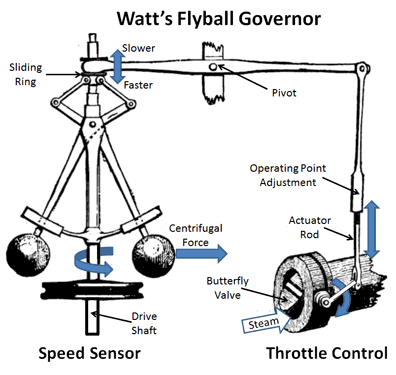
(diagram from here)
And indeed Primary Frequency Response on synchronous generators is typically delivered through “governor” settings, although these days the governors are a lot more sophisticated and rely mostly on electronic transducers and logic circuits rather than spinning weights and mechanical linkages.
Without getting into the fine detail of AEMO’s specifications, the mandatory PFR requirements authorised by the AEMC require NEM generators where possible to automatically vary their output away from their market-determined “setpoints” (essentially five minute NEMDE targets) in proportion to any frequency deviations outside of a very small “deadband” around 50 Hz. This deadband is nominally 49.985 – 50.015 Hz (ie one tenth the width of the Normal Operating Frequency band) – when frequency is within the deadband, no PFR is required to be delivered.
If locally measured frequency falls somewhere below the lower deadband limit – to say 49.93 Hz, online generators with PFR operating are each expected to nudge their output upwards to resist the falling frequency. Similarly they are expected to nudge output down if frequency exceeds the upper end of the deadband. The amount of the nudge should be proportional to the size of the generator and the degree to which the frequency is off-target.
In terms of our system frequency see-saw analogy, we can think of PFR as providing stabilizing springs designed to keep the see-saw more level:
There are some important exclusions to these requirements – for example, in response to low frequency wind and solar plants are not expected to somehow provide higher output when already producing the maximum power available from ambient wind and sun. However in general all generators are progressively expected to deliver PFR according to these new requirements under a staged implementation process being managed by AEMO (see below).
Like almost any rule change in the NEM, AEMO’s proposal to make provision of PFR mandatory was far from uncontroversial, with stakeholders arguing that there were better, cheaper and more efficient ways to address the frequency control problem than by slapping a new regulatory requirement on all generators. Discussion of the alternatives is outside the scope of this article, but you can find stakeholder views expressed via the AEMC consultation web pages. Notably, the AEMC placed a three-year sunset on the mandatory PFR rule change, stating that “…the Commission recognises that a mandatory requirement for narrow band primary frequency response is not a complete solution for the long term …”. Further work on this front is being carried forward via various NEM transition workstreams including the ESB’s post-2025 “NEM 2.0” re-design process.
PFR Implementation Timetable
Introduction of the new PFR requirements is being managed by AEMO and affected generators in a staged process, commencing with the largest NEM generators. Due to the need for all generators to self-assess their ability to comply with the requirements and for AEMO to review these assessments and any requests for variations and exemptions, the dates on which individual units commenced or will commence providing PFR are variable. AEMO publishes regular status updates showing detailed implementation progress and impacts on frequency control outcomes.
From late September – early October this year, PFR started being rolled out at the NEM’s larger generators. We can see an example of the change in generator response to frequency deviations by comparing snapshot traces of the four second output of one of Loy Yang A’s generators for a few dispatch intervals on some selected days in 2018, 2019 and 2020:
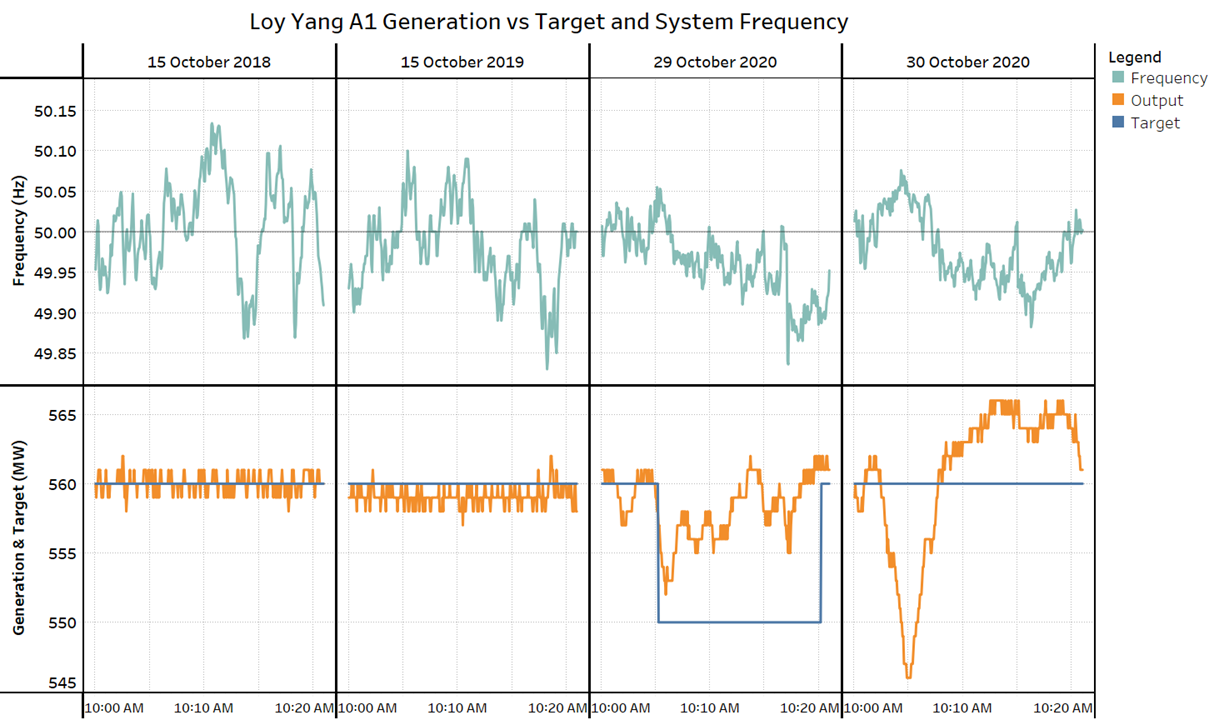
PFR on this generation unit was enabled from 14 October, and it’s clear that prior to its implementation this generator would stick to its dispatch targets impervious to any movements in system frequency, whereas recently its output has shown significant movements in response to changing frequency which are in the direction expected given the sign of any frequency deviations from 50 Hz.
So is it working?
We can see the overall impact of PFR being progressively enabled and tuned across the NEM generation fleet by comparing recent frequency behaviour against that prior to implementation of the rule change. This chart compares the frequency distribution for two days at the start and end of this October against that for 1 May charted earlier:
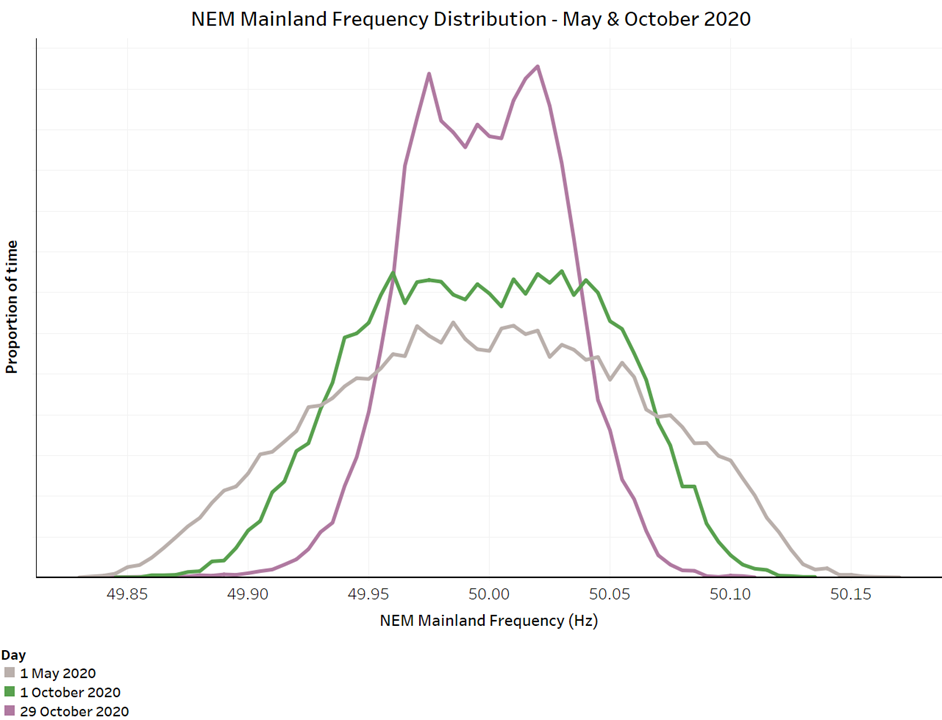
By the end of October, frequency was clearly more tightly controlled and mostly within +/- 0.05 Hz of 50 Hz, with very little time outside +/- 0.1 Hz. We can probably also see the effect of the PFR deadband in the relatively flat central part of the distribution for 29 October, bounded by sharp inflection points at about 49.975 Hz and 50.02 Hz. As more generation units enable and tune PFR settings, we might expect to see the distribution narrow further.
Which brings us back really to the very chart that kicked off this article, but hopefully the meaning of that chart and why it matters are now a little bit clearer.
About our Guest Author
 |
Allan O’Neil has worked in Australia’s wholesale energy markets since their creation in the mid-1990’s, in trading, risk management, forecasting and analytical roles with major NEM electricity and gas retail and generation companies.
He is now an independent energy markets consultant, working with clients on projects across a spectrum of wholesale, retail, electricity and gas issues. You can view Allan’s LinkedIn profile here. Allan will be sporadically reviewing market events here on WattClarity Allan has also begun providing an on-site educational service covering how spot prices are set in the NEM, and other important aspects of the physical electricity market – further details here. |
Leave a comment