Back on 5th October I’d posted some thoughts about the risks that new COVID-induced lockdowns might impose on the NEM especially if this were to happen through the peak summer periods.
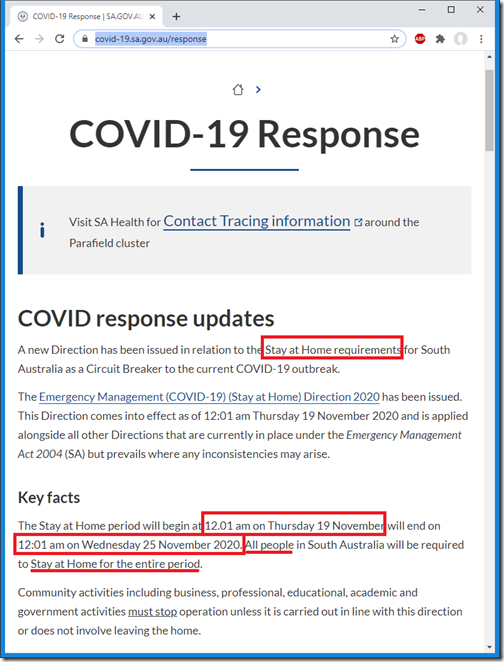
This week we’ve seen the South Australian government announce what they currently hope is a short, sharp ‘Circuit Breaker’ to enable them to stop the spread of a fast-reproducing strain of COVID-19. There are some details here, but the key points from a NEM perspective are:
1) Very stringent lockdown; and
2) Short duration currently envisaged (i.e. from this morning to Wednesday morning next week (25th Nov)):
It seemed to me that the following would be of broader interest:
(A) How have forecasts for electricity Demand changed?
The AEMO runs an ST PASA process that updates forecasts for demand at 30-minute granularity spanning the coming 7 days, and updates this every 2 hours.
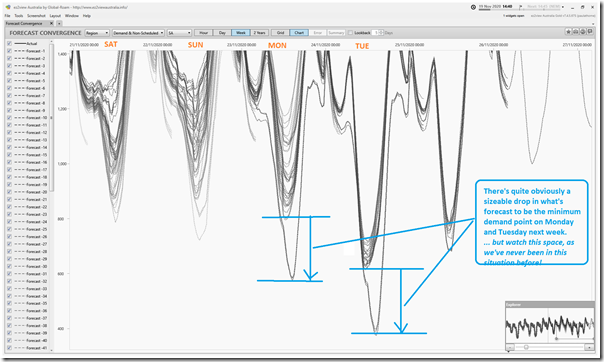
One of the values of the ‘Forecast Convergence’ widget in ez2view is that it enables the user to see how successive forecasts have changed. As we can see in the zoomed-in snapshot below, there is a marked difference in the forecast low-point of ‘Demand and Non-Scheduled Generation’ (which is a reasonable proxy for what the AEMO calls Operational Demand) for the middle of the day:
We can see here quite clearly that the low point of demand forecast for Monday (23rd Nov) and Tuesday (24th Nov) next week is significantly lower … maybe 200MW!
Not the case for Wednesday 25th November though (i.e. outside the currently prescribed ‘Stay at Home’ order).
Coming on top of recent instances of ‘lowest demand in South Australia’ like on 11th October 2020 (and AEMO’s notes about ‘Operational management of low demand in South Australia’) it obviously is an added complication to watch unfold.
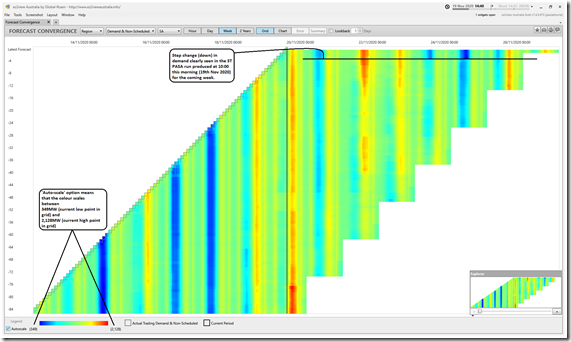
Flipping to ‘GRID’ view and zooming out to see the full range of the data, we can clearly see a step change (downwards) in the demand forecast:
We can see that the ‘fade to blue’ is particularly pronounced in the forecast for Tuesday next week (24th November), presumably off the back of mild weather forecast. In contrast Saturday 21st November looks set to be a hotter day.
(B) Uncharted territory
It really is uncharted territory for the boffins at the AEMO who are in the operational forecasting team as they attempt to take account of the different (and perhaps conflicting) impacts on electricity consumption in South Australia. It would be a very difficult job for them to deal with a situation that’s never been encountered before!
There are bound to be more factors, but here’s just three for a start:
Impact #1) The ‘stay at home’ order obviously means that electricity consumption will be down significantly at many commercial energy users … the corner store, the bakery, the small office and so on.
Impact #2) What’s probably more uncertain, at this point, is what it means at the major industrial energy users that make up a large percentage of consumption across the NEM, including in South Australia (though the percentage is probably lower there than in some other regions).
2a) A number of these energy users are clients of ours (we serve them in this way)
2b) We wonder what this means for them … do they also have to close, in which case that would be a massive impact on demand in South Australia:
(i) this would be significantly larger than the 200MW step-change shown above – keeping in mind that ‘Operational Demand’ is a Grid Demand figure, which is really ‘Underlying Demand’ less injections from embedded generation that’s not seen on the grid (primarily rooftop PV)).
(ii) This might, in turn, rapidly bring the future forward (i.e. that future for which the AEMO had voiced about ‘minimum demand’ dropping to levels much closer to 0MW) and what happens then?
Impact #3) We all know that electricity consumption is very temperature-dependent (for space heating/cooling, primarily) – but that is particularly the case in South Australia moreso than any other region in the NEM.
(i) Should this lockdown continue into the real hot weather, the combination of ‘stay at home’, many residential air-con units running full tilt and reduced underlying consumption because of COVID restrictions is very concerning
(ii) this was alluded to back on 5th October.
Let’s watch this unfold…


Leave a comment