This is now the 10th Case Study in a series, with each looking at one or more of the 98 discrete Dispatch Intervals (2013 to 2019) identified as having extreme outcomes for aggregate under-performance or (more rarely) over-performance across all Semi-Scheduled plant:
1) We’re using the Aggregate Raw Off-Target measure, which we analysed across 2019 in our Generator Statistical Digest 2019, and have embedded into our ez2view software.
2) We’re specifically looking at values greater than 300MW:
(a) Of the 98 dispatch intervals, only 5 were of collective over-performance;
(b) Hence the remaining 93 dispatch intervals were of collective under-performance.
3) The first 8 Case Studies covered 2013, 2014, 2015 and 2016, whilst yesterday’s 9th and today’s 10th Case Study cover 2017.
(a) Only 10 events in 5 years is pretty sparse data.
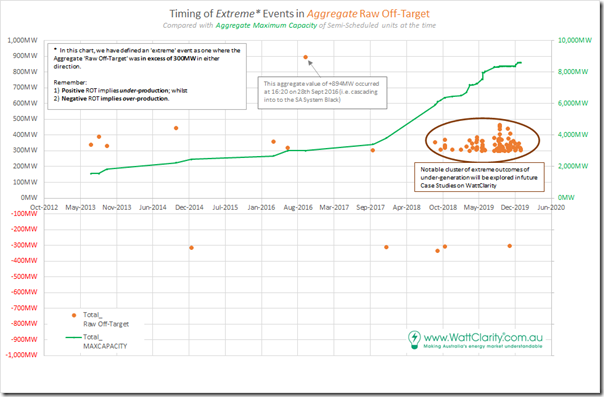
(b) However, the chart below highlights that the small leak became a gusher from September 2018 through to December 2019 – with 88 discrete incidents in only 16 months:
(c) Note also that we have not yet looked into 2020 data, which will be the focus of the GSD2020 (so we can’t comment on whether the trend from 2019 has continued to grow).
(d) Based on the data shown above is a clear escalation in extreme variability, and we’re walking through these Case Studies in order to understand why and what the implications are of this.
(e) It seemed logical to start at the start, however, to establish what the underlying causes were of each of the early (10) extreme events – so we can then keep them in mind to see if something different has started happening in more recent times.
4) We’re doing this given a push from the AER Issues Paper, but moreso inspired by the deliberations by the (now defunct) COAG Energy Council and (under threat?) ESB relating to ‘NEM 2.0’.
—————-
… so let’s look at this particular event:
(A) Summary results for Monday 18th December 2017
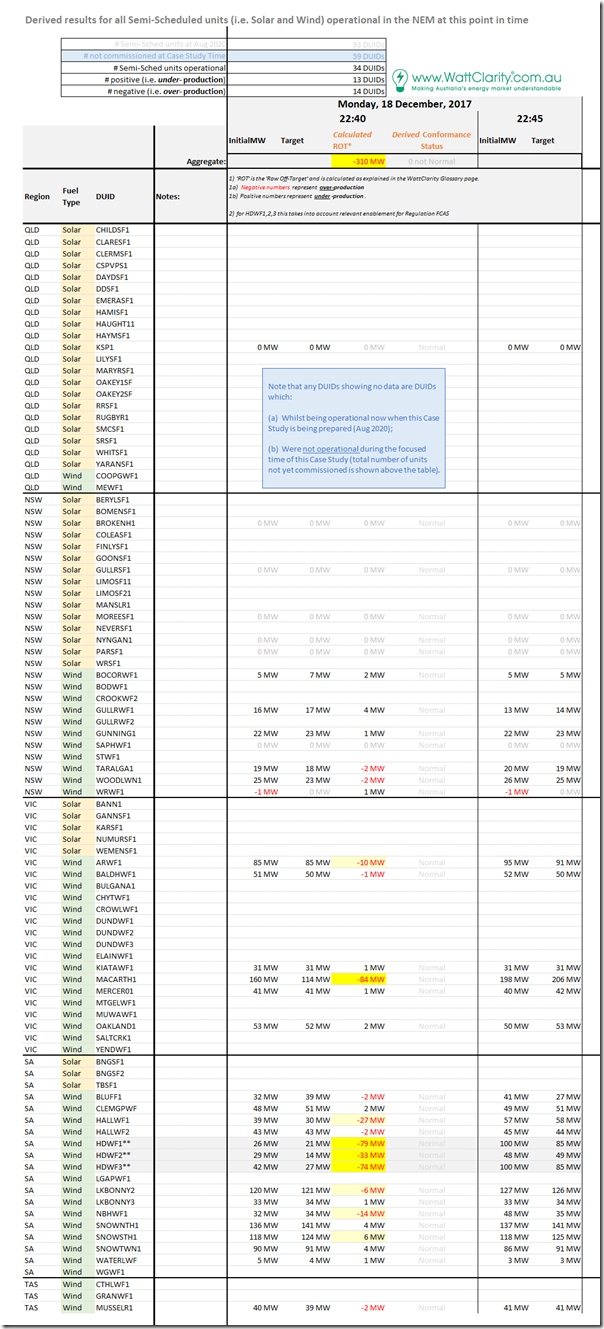
Let’s note, for a start, that this incident is one from a total of (only!) five incidents where aggregate over-production was more than 300MW above the aggregate Target for all Semi-Scheduled plant. Here’s the same tabular framework of results for individual Raw Off-Target performance of all Semi-Scheduled units that were operational at the time:
As we can see in this table:
1) There were 34 units operational at this time – of which a roughly even number of units were under-performing (13 DUIDs) as there were over-performing (14 DUIDs)
2) However the large over-performances at 4 units in particular swamped the aggregate result.
… and so we will explore each of these below, working top-to-bottom on the table.
(B) Results for individual DUIDs
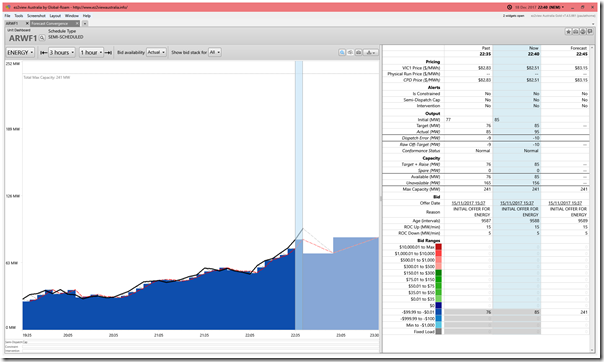
Again we can show this specific dispatch interval clearly with the ‘Unit Dashboard’ widget in ez2view, wound back 3 years ago through the powerful ‘Time Travel’ functionality:
(B1) Ararat Wind Farm in VIC
The ARWF1 is softly highlighted because of a slight over-performance (i.e. ROT = –10MW):
(B2) Macarthur Wind Farm in VIC
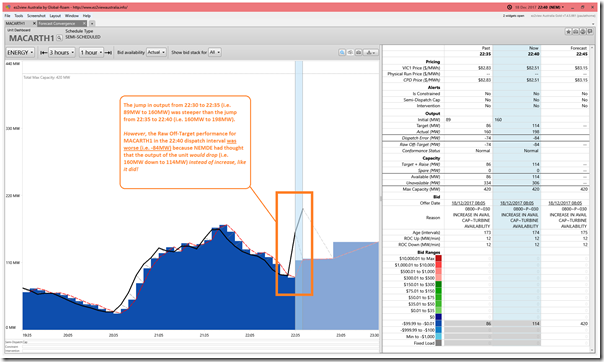
The deviation of MACARTH1 is significantly larger at 84MW over-performance:
As annotated on this image, we see that the Raw Off-Target performance was worse than the increase in output would imply – and that this was because:
(i) NEMDE had anticipated that the output would fall substantially; and yet
(ii) The output actually rose.
As we have seen through a number of different articles where it has been mentioned, Macarthur Wind Farm (due to size, and other factors) has its own unique idiosyncrasies!
(B3) Hallett 1 Wind Farm in SA
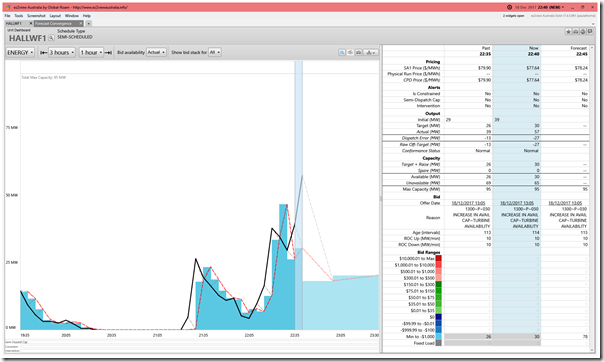
Moving into South Australia we take a look at HALLWF1 where the over-performance was 27MW:
Again, here’s another case where the actual direction of output was the reverse of what NEMDE thought would happen.
(B4) Hornsdale 1, 2 and 3 Wind Farm units/stations in SA
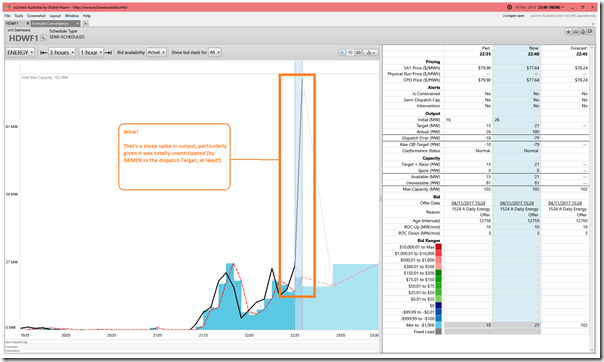
Given that they are physically located in close proximity and that they are all significantly over-performing (for the same reason), it’s worth viewing HDWF1, HDWF2 and HDWF3 together:
(i) Hornsdale 1 Wind Farm
Look at that sharp spike in output (26MW to 100MW!) which was not anticipated in the Dispatch Target for the unit in the 22:40 dispatch interval:
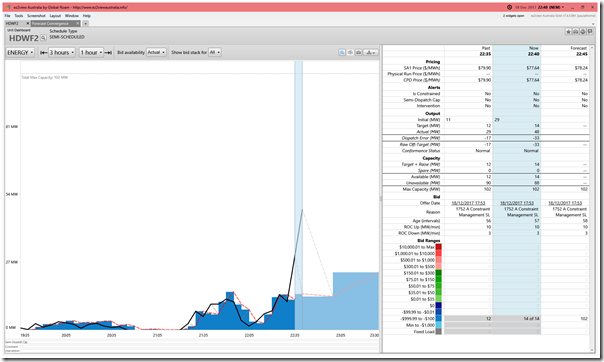
(ii) Hornsdale 2 Wind Farm
Same type of story with the 2nd stage of the farm, but not quite as steep (29MW to 48MW), but what makes the Off-Target value larger is that the AEMO was anticipating the output would actually drop (29MW to 14MW), like with stage 1 and also stage 3:
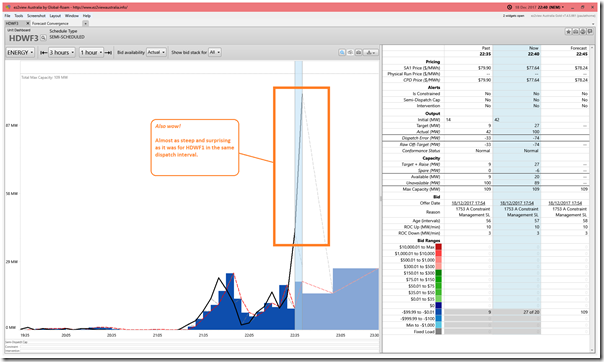
(iii) Hornsdale 3 Wind Farm
With HDWF3 we also see a sharp (and unanticipated) spike in output that appears ‘out of the blue’, at least from the perspective of NEMDE:
The Raw Off-Target value here (-74MW) is just below that of HDWF1 (-79MW), but note both are still below MACARTH1 (-84MW) – though an argument should be made that the HDWF results should be aggregate to be really comparable as a unit about the same size as Macarthur Wind Farm. If we did that, we can more clearly understand the very large size of the surprise on this occasion.
(iv) Across HDWF1 + HDWF2 + HDWF3
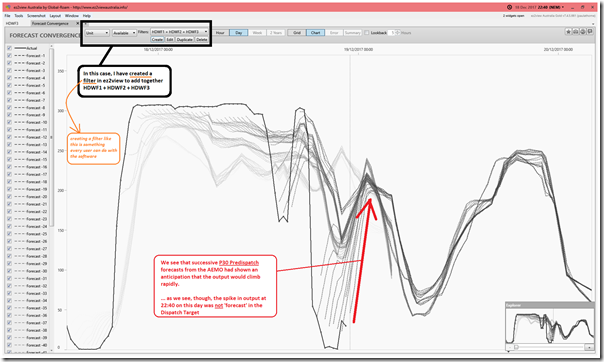
Using the ‘Forecast Convergence’ widget again in ez2view to highlight how the AEMO’s successive P30 Predispatch (energy-constrained) Available Generation values changed through the evening, we see that the AEMO was fairly consistent in forecasting a sharp rise in capability across the three units:
… which does beg the question about why it was not seen in the Dispatch Target (which instead, in this instance, forecast output declining at each of the 3 stages).
My understanding is that (as noted here for 23rd June 2016 in reverse for MACARTH1) this is because:
Reason 1 = essentially there are different systems used at AEMO (for Dispatch Target, and for P30 Predispatch) both referred to under the ‘AWEFS’ umbrella, but:
(a) They don’t talk together real well;
(b) In intervals where the Semi-Dispatch Cap flag is OFF, the Dispatch Target is derived by a logic that contains a large element of persistence (though not totally).
Reason 2 = more fundamentally, though the AEMO might know the wind speed is going to sharply increase (as in this case), picking the exact dispatch interval where this will happen is quite difficult!
Reason 3 = this incident (back in December 2017) also pre-dates some enhancements made to the broader AWEFS process, including the inclusions of self-forecasting (which we will be keen to review as part of the GSD2020).
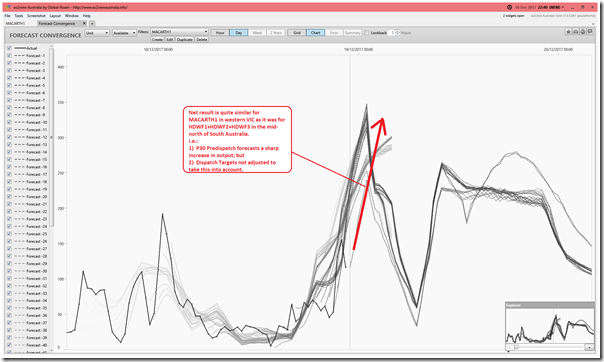
(v) Same as at MACARTH1
What’s particularly interesting to me is that this phenomenon appears to have happened across three units at HWDF in South Australia and also at MACARTH1 in western Victoria in the same dispatch interval. Here’s the ‘Forecast Convergence’ view for MACARTH1:
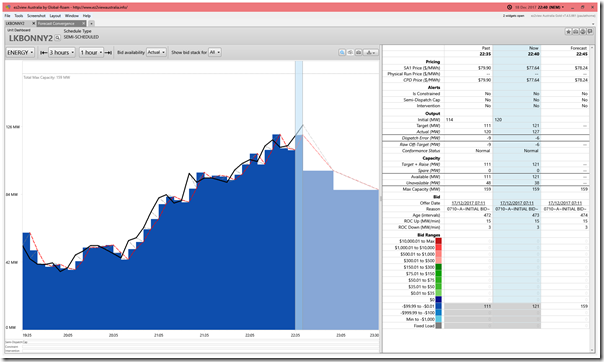
(B5) Lake Bonney 2 Wind Farm
LKBONNY2 is (slightly) highlighted for an over-performance of 6MW
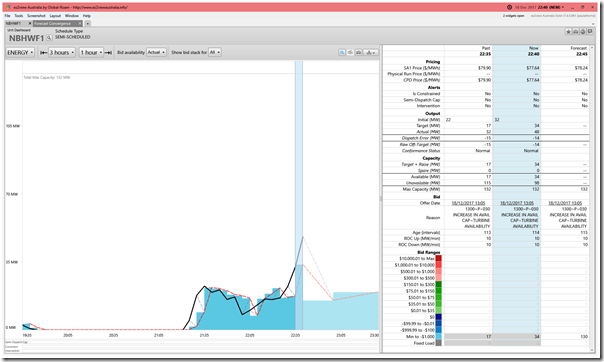
(B6) Hallett 4 (North Brown Hill) Wind Farm
NBHWF1 is (slightly) highlighted for an over-performance of 14MW
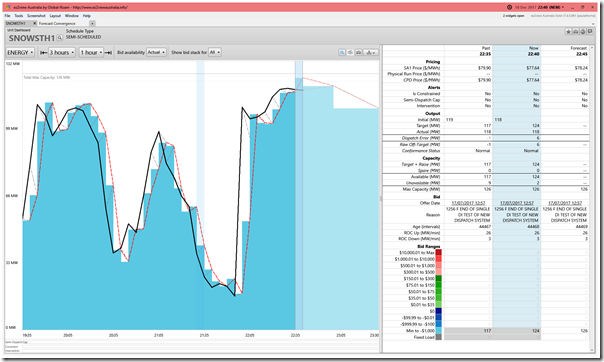
(B7) Snowtown 2 South Wind Farm in VIC
SNOWSTH1 is the only DUID with an under-performance (slightly) highlighted, being just over 6MW Raw Off-Target:
————–
That’s all I need to include in this Case Study.
10 down, and 88 to go (focused on the 16-month period September 2018 to December 2019).


Leave a comment