As noted in my article on Sunday afternoon, (as time permits) we will be working to explore more details at what happened through the afternoon of Friday 31st January 2020 – and its implications for the future.
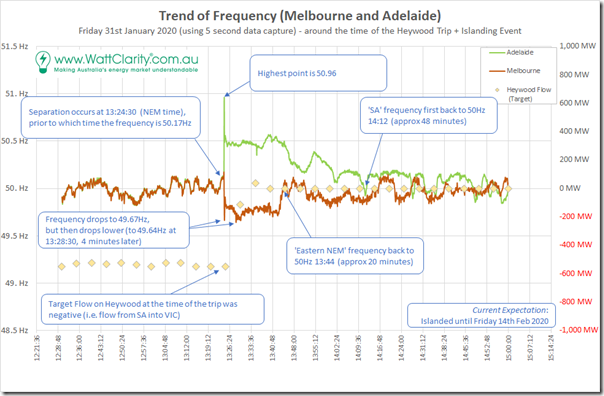
Let’s start by firstly working with the data set we’ve obtained of system frequency* (at 5 second snapshots) in both Adelaide and Melbourne – as shown in the following trend:
* we are working to have a live feed of data like this added in to our ez2view software (in the not-too-distant future), and will discuss this more directly with those clients
Onto this first chart i have included the point-in-time values of what the Target Flow was on the Heywood interconnector (which the output from NEMDE reflecting market dispatch, and is what’s shown in the NEMwatch snapshots included in prior articles on Sunday and Friday).
From this first chart (which has separated from that below as it only contains ‘real’ data) we can see that the frequency spiked in South Australia and dropped in Victoria, which is understandable given that VIC was importing from SA at the time of the transmission outage. We can also see the dispatch targets for Heywood drop to 0MW (i.e. it can’t play a role in pricing in dispatch).
* for those readers who are unfamiliar, this article has a good illustration of how frequency changes with the changing balance between supply and demand
A few quick observations:
1) Separation appears to have happened at 13:24:30 NEM time (or within 5 seconds of this), assuming the timestamp is correct.
2) The highest point the frequency reached in South Australia according to this data was 50.96Hz – which (according to my reading of the Frequency Operating Standards is just acceptable – i.e. under 51.0Hz – for ‘containment’ after a ‘network event’ – however I do caution that this particular area is not my forte!).
3) It is also worth noting that these frequency snapshots are 5 seconds apart, which would be like a lifetime around the precise time of the network event. It may have risen well above 50.96Hz for a short period.
4) For both reasons, it’s best to wait for AEMO to publish something with high speed data (and more expertise than I have) to read too much into what happened there in this respect!
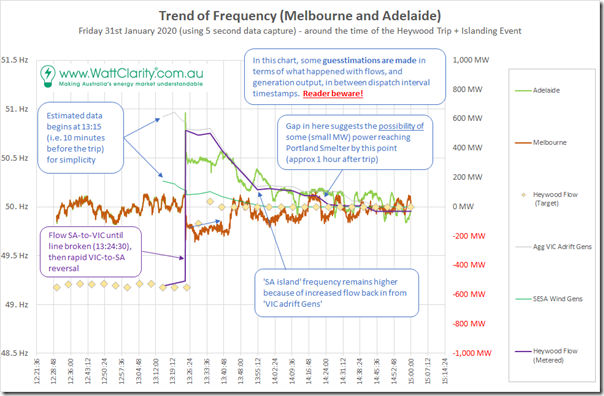
Adding in some other data from the MMS and applying a bit of guesswork (which may well be incorrect) we come up with the following modified chart, including my guesstimates of what was going on in western VIC and south-eastern SA:
Using this chart to illustrate a few points, I am guessing that:
Guess #1 = virtually instantaneous with the transmission line outage at 13:24:30 several large events happened on the western side of the disconnection:
1a) We’re guessing that the Portland aluminium smelter tripped instantaneously; but
1b) A group of generators in western VIC which I have labelled ‘VIC Adrift Gens’ (now cut off from Melbourne) continued to generate; so
1c) As a result, power flow on the line connecting the Portland area and the SA grid immediately switched in direction, pushing power from these generators (a sequential, but not additive, effect would have been that power flow would have also turned around from the SA generators in the south-east).
1d) This large shot of power back into central SA (i.e. a net reversal of more than 1,000MW approximately) happened simultaneously with the tripping of rooftop PV systems across South Australia, which led to a large increase in Scheduled Demand noted on Sunday …
1e) … which was a good result (i.e. rooftop solar tripping), on balance, as otherwise the system would have oversped further and sent the frequency even higher (possibly then triggering other generation to trip).
Guess #2) On the eastern side of the disconnection, the ‘net system’ was larger:
2a) the net change is approximately the loss of supply from ‘VIC Adrift Gens’ (i.e. assuming that imports from SA had been supplying the consumption in the Portland area (incl the smelter)
2b) hence because of loss of flows eastwards from Portland to Melbourne on the 500kV line, the frequency drops.
2c) because of the net ‘eastern NEM’ system size, the frequency did not drop too much
2d) recovery is determined by response actions taken (which are not examined here).
2e) it takes 20 minutes to recover frequency back to 50Hz (which is shorter than the time in ‘SA island’ grid, but is it short enough?)
Guess #3 = This shot of adrenalin received in the SA grid would seem to help explain why the SA region frequency remained higher for longer, and took some time to recover. Indeed, my guesstimated trend of declining flows back into SA seems to line up fairly well (but remember I might have screwed something up here!)
Guess #4 = Beginning about an hour after the trip, we see a gap start to open up between the remaining generation from ‘VIC Adrift Gens’ and the transfers into SA.
4a) If these numbers are correct (a big if) this would imply the power was being consumed somewhere.
4b) Perhaps at this point AEMO had managed to start to get some power back to Portland Aluminium Smelter?
… but remember this is all guesswork!
Over to the more learned power system boffins amongst our readership – how did we do in the guesswork above?
——
Also, don’t forget, we’re investing time to complete analysis like this for a couple of reasons (including these two) and would like to hear from you if you know people who can help us do this better!?
——
PS1 on Tuesday 4th February
Readers here might be interested in some of the comments being made on this thread here on LinkedIn.
—–
PS2 on Tuesday 4th February
On Tuesday morning, 4th February, guest author Allan O’Neil follows on from the look at frequency above to use AEMO’s 4 second SCADA data and have an initial look at ‘How did the lights stay on in South Australia?’ given such a large (approx) reversal of flows.


Here is the Portland Smelter (APD) Load from 13:00 hrs on Fri 31 Jan 2020 through to 00:00 hrs on Sun 03 Feb 2020 .. http://nemlog.com.au/nlog/portland-smelter-load-on-fri-31-jan-2020/
The Smelter was offline from 13:24:56 to 16:09:32, a total of 02h 44m 36s with load gradually restored over the next 6-7 hrs. We can also see the output of two 294 MW Gas Units at Mortlake and the Heywood to South East Line Flows where it is apparent that AEMO moved to the reduce this flow to zero by approximately 16:47 hrs on Sat 01 Feb 2020.
Thanks Geoff!
That’s really interesting Geoff and Paul.
From the logs you’ve provided it looks like the V-SA interconnector remained connected through the fault and started supply back into the SW region. AEMO have then re-synchronised Mortlake to SA which is supplying the bulk of SA the FCAS (which explains the request for large amounts of FCAS in SA Friday night; can you check that please Paul?)
Seems that SA is still connected to SW Victoria & Mortlake. AEMO’s dashboard is not showing flows though (they’ve disabled it when the website went down?).
I’m not sure on Mortlake’s black start/grid forming abilities but I suspect they’ve used SA to do it. I’ve also noted the SA batteries got a hell of a workout Friday too.