Our Generator Statistical Digest 2019 (developed in conjunction with Greenview Strategic Consulting, and released today) enables readers to view, analyse and understand a wide range of different technical and commercial aspects of performance of all types of generators registered with the AEMO across Australia’s National Electricity Market (NEM).
One of the metrics included for every DUID (i.e. unit) with monthly stats through 2019 in the GSD2019 is that of ‘Raw Off-Target’.
(A) What is ‘Raw Off-Target’?
In simple terms, ‘Raw Off-Target’ is a measure of how closely every unit follows the expectations AEMO holds for it – and is a measure that applies in every Dispatch Interval, and for all* DUIDs that are Scheduled or Semi-Scheduled.
*the AEMO does not publish its expectations for Non-Scheduled plant in the form of ‘Targets’ so it is mathematically impossible to calculate an ‘Off-Target’ severity for Non-Scheduled plant. Implicitly the NEM Rules are assuming that the contribution of Non-Schedule plant is sufficiently small such that ‘unexpected variations’ are not going to make a large difference, in aggregate.
Remembering the basic principles of frequency control and FCAS provision, if (in aggregate) units don’t supply as much as the AEMO is expecting them to supply the frequency will drop across the grid as a whole. The inverse is an inherent characteristic as well – too much supply (compared to demand), will overspeed the system.
Without falling down the rabbit hole of more detailed considerations*, the more the AEMO needs to take explicit steps dispatch outcomes not meeting expectations, the more volume they will need to enable for FCAS services – and hence the more expensive these services become to the market as a whole. It’s in all of our interests to see ‘Off-Target Errors’ as low as practicable.
* these more detailed considerations would include system inertia (see here), primary frequency control (see here and here) and the possible introduction of fast frequency response (see here).
Units are quite frequently not perfectly On-Target (i.e. Raw Off-Target ≠ 0MW). Readers need to understand that it’s the size of the Off-Target that matters.
That’s why (in the GSD2019 and in this article) we include consideration of the number of hours in which each DUID is, individually, assessed as being either:
Under-producing in a large way (i.e. ‘Raw Off-Target’ > +30MW); and
Over-producing in a large way (i.e. ‘Raw Off-Target’ <-30MW)
(A1) How do we calculate ‘Raw Off-Target’
There’s an extensive 22-page Glossary provided within the GSD2019 itself – and it’s also worth noting that there’s also a long explanation of ‘Off-Target’ here, as part of this (evolving) Glossary on the WattClarity site.
One of the main points for readers to remember (with reference to prior articles on WattClarity and in the GRC2018) is that we’ve flipped the direction of the calculation now in ez2view and for the GSD2019 in order to ensure the number sign is aligned with the way it is (much more explicitly) specified by AEMO for ‘Dispatch Error’.
Hence this means that:
| A positive ‘Raw Off-Target”… | … indicates that Output was below the AEMO dispatch target (under-production) – which includes, but is not limited to, instances of unit trips. |
| A negative ‘Raw Off-Target”…
|
… indicates that Output was above the AEMO dispatch target (over-production). |
There’s more details about how it’s calculated, however that’s the general gist of it….
(A2) What ‘Raw Off-Target’ is not
… but before we go any further, it’s important to note that that Raw Off-Target is not synonymous with Dispatch Conformance (which the AEMO assesses*), or Compliance Status (which the AER assesses).
* We have automated the published processes that AEMO uses for assessing Dispatch Conformance Status into our ez2view software, and also include the results for this as a separate report within the GSD2019.
Hence readers should use extreme caution in reading the results noted below before lurching to attribute ‘blame’ for apparent poor performance in relation to ‘Raw Off-Target’.
(A3) Why a unit might be Off-Target
Back in January 2019, whilst we were in the process of developing the GRC2018, I posted this article noting that units might be Off-Target might be Off-Target for a number of reasons, including those in the following table:
| Units might be Off-Target for a number of reasons…
|
… which we explain briefly here. |
| Reason 1) A unit might trip unexpectedly
|
… in which case it would be a large positive Off-Target, except if it were a Scheduled Load, in which case the Off-Target would be negative.
Whilst Trips seem to gain widespread coverage amongst the broader energy sector stakeholder group (we have specific queries written in ez2view to highlight suspected trips of key units in real time), it’s important to keep in mind that trips are relatively rare occurrences (i.e. low probability but high consequence). There are many more instances where a generation unit might have a positive Off-Target but not actually trip. |
| Reason 2) A unit sometimes fails to start
|
… such as illustrated in this case study of Braemar A3 failing to start back on 29th August 2018, using what is (now) quite an old version of the ez2view software (v7.4.5.223). |
| Reason 3) Sometimes forecast output of Semi-Scheduled plant are not as good as we’d like them to be
|
… such as illustrated at the time using this case study of Macarthur Wind Farm oscillating in output quite wildly through 11th August 2018, using the same old version of the ez2view software (v7.4.5.223). |
| Reason 4) Sometimes unit behaviours are questionable
|
… which was illustrated at the time using this case study of behaviours at Lake Bonney 2 Wind Farm on 24th July 2018 being inverse to that inferred by AEMO with respect to the bidding behaviour
Thankfully we don’t see too many instances of this type of thing occurring… |
| Reason 5) Being locally triggered for Contingency FCAS based on local frequency
|
… but notably not for Regulation FCAS enablement (as that’s already taken account of in the calculation of ‘Raw Off-Target’).
I have not had time to identify specific cases where this has happened, but it’s likely that these sorts of exceptions will have happened at times of non-credible contingencies occurring. |
Again, the headline here for readers of this article (and recipients of the GSD2019) is that we should not leap quickly to attributing ‘blame’ (despite the fact that doing so seems almost a natural tendency, especially during times of stress).
The reasons why a unit might be Off-Target are multiple, and complex.
Whatever the reasons, an increased incidence (and severity) of ‘Raw Off-target’ will be imposing costs and complexities on the market more broadly.
(B) Results for all units through CAL 2019
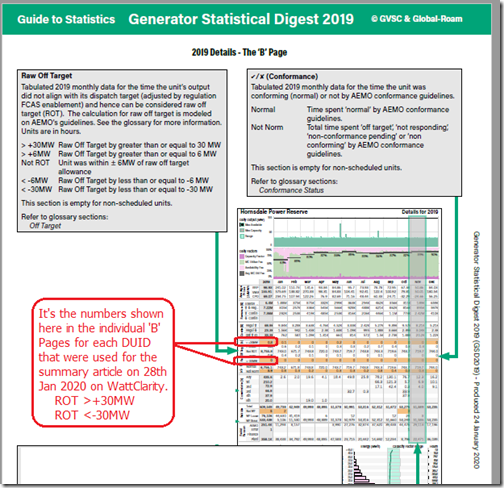
In the GSD2019 the results for ‘Raw Off-Target’ are tabulated for every* DUID on the ‘B’ pages as noted in the following explanatory page:
* We can’t compute this Metric for Non-Scheduled plant – so these stats were excluded for those Non-Scheduled units (and hence in this article).
(B1) … all DUIDs, by Fuel Type
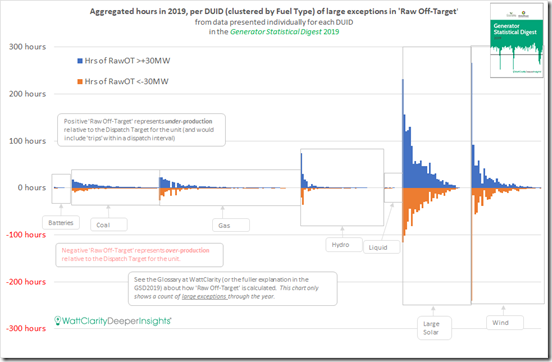
Using this tabulated data as the starting set (i.e the two data points for every DUID – being annual total for >+30MW and <-30MW) I’ve summarised the results for all units in the following chart:
For clarity I have grouped results for all fuel types, and sorted each fuel-type group in descending order of total hours of large excess in either direction. It’s clear that there are essentially three separate groups of units:
| Batteries and Liquid Units | Using the scale shown in the chart above, the stats for Batteries, and Liquid-Fuelled Generators (20 DUIDs in total) are almost invisible.
There’s not many units of either operating currently (battery DUIDs also include the charging components), and their excess Off-Target performance is minimal. … however it’s important to note (for those who believe battery operation is always perfect) that there are a few hours shown up through the year where excess was outside of the 30MW tolerance. |
| Coal, Gas and Hydro Units
|
There were 172 DUIDs in this grouping (78 gas-fired, 48 coal-fired and 46 hydro), so many more than the other 2 groupings – and also in volumetric terms still the dominant share of energy in the NEM.
There is a spread of excessive Off-Target performance – but in general terms this is biased on the side of most instances of excess being under-production. Specifically we see, aggregating across all 172 DUIDs in this group: (a) the excesses of under-production (ROT>+30MW) totals to 646 DUID-hours across these 172 DUIDs (or 3.8 hours per DUID on average) but; (b) only totals to 367 hours large over-performance (ROT<-30MW) – averaging to 2.1 hours per DUID on average. |
| Large Solar and Wind Units
(i.e. Semi-Scheduled units)
|
This grouping of 77 DUIDs in total (38 solar and 39 wind) clearly shows consistently the largest excess ‘Raw Off-Target’ in both directions.
In particularly for Wind, there is one DUID that stands head-and-shoulders above all of the others in terms of its excess ‘Raw Off-Target’ in both directions. More generally across these units, we see a more evenly balanced excess on either side of the ledger: (a) the excesses of under-production (ROT>+30MW) totals to 2,395 DUID-hours across these 77 DUIDs (or 31 hours per DUID on average – 8 times the duration of excess for coal+gas+hydro); and (b) also totals to 1,733hours large over-performance (ROT<-30MW) – averaging to 22.5 hours per DUID on average – which was more than 10x the duration of excess for coal+gas+hydro. Readers are cautioned, once again, against immediately drawing conclusions about ‘blame’ in this respect. |
Please be clear that, with respect to the above (or what follows):
1) This should not be read as a criticism of any particular power generation technology, or fuel type;
2) And nor is it a particular criticism of any particular Operators of these assets.
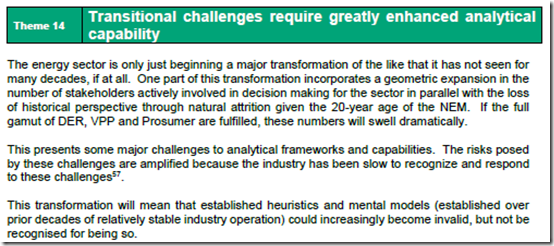
We wrote (in Theme 14 within part 2 of the 180-page analytical component within the GRC2018) that our ‘transitional challenges require greatly enhanced analytical capability’:
… and this is one example of where a deeper level of thinking, and analytical capability, is required.
(B2) … selected ‘Worst Performers’ in CAL 2019
In order to understand what the implications of this might be, I’ll highlight some of the ‘worst’ performers in some of the Fuel Type categories – and (when time permits in future) look forward to drilling into some particular instances through focused Case Studies.
However before we step through these particular DUIDs, readers need to understand that others won’t feature so heavily if they were offline for a considerable period through 2019, or if their Maximum Capacity is smaller than others in the group.
(B2a) Macarthur Wind Farm – ‘worst’ Wind Farm (and ‘worst’ DUID in total)
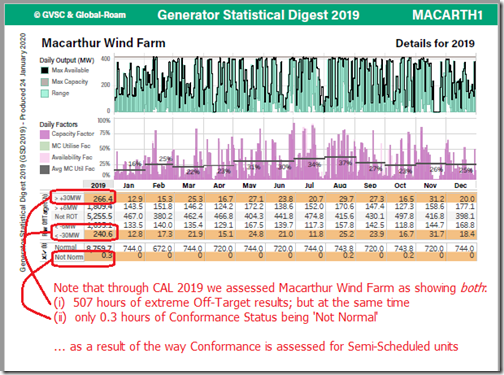
In aggregate Macarthur Wind Farm was the ‘worst’ performing DUID in the NEM across CAL 2019 by a considerable margin – seeing extreme ‘Raw Off-Target’ for a total of 507 hours across CAL2019, with:
(i) Extreme Over-Production for 240.6 hours (ROT <-30MW)
(ii) Extreme Under-Production for 266.4 hours (ROT >+30MW)
In order to reinforce, to readers, why it’s important to think more deeply before jumping to attribute ‘blame’ I have included some of the ‘B’ page for Macarthur Wind Farm from the GSD2019 for general benefit:
We can see clearly that despite having the largest aggregate duration of ‘Raw Off-Target’ of any DUID in the NEM through CAL 2019, our replication** of the AEMO’s automated* assessment of Conformance Status calculates out at only 0.3 hours where Conformance Status is ‘Not Normal’ across the whole of the year
* the AEMO can also manually determine Conformance Status in some circumstances. Obviously we cannot replicate this logic.
** we do believe our replication process is correct, and have been checking this regularly with participants over the past 6 months or so. If you are a participant and would also like to help us with this verification, let us know.
The reasons for such a large difference are discussed further below. As time permits, I would like to delve into specific details for Macarthur Wind Farm and discuss here.
(B2b) Daydream Solar Farm – ‘worst’ Solar Farm
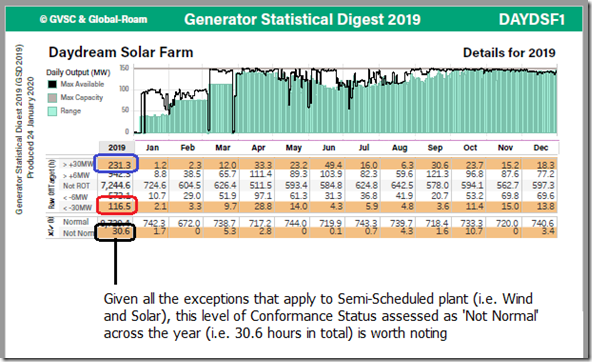
In aggregate Daydream Solar Farm was the ‘worst’ performing of the 37x Solar Farms operating in the NEM across CAL 2019 by a considerable margin – seeing extreme ‘Raw Off-Target’ for a total of 348 hours across CAL2019 (more than 90 hours greater than the ‘next worst’), with:
(i) Extreme Over-Production for 116.5 hours (ROT <-30MW)
(ii) Extreme Under-Production for 231.30 hours (ROT >+30MW)
Given that I’d included included an excerpt of the ‘B’ page for Macarthur Wind Farm above I thought it would be useful to do a similar thing for Daydream Solar Farm:
This case is a little different than for Macarthur Wind Farm – because (even though it’s an order of magnitude less than the number of hours of extreme Raw Off-Target, a total of 30.6 hours where the Conformance Status has been assessed as ‘Not Normal’ over the year stands out (see section C below for a discussion).
(B2c) Shoalhaven Pump – ‘worst’ Hydro DUID
In aggregate Shoalhaven Pump saw extreme ‘Raw Off-Target’ for a total of 93.8 hours across CAL2019, with:
(i) Extreme Over-Consumption for 20.5 hours (ROT <-30MW, remembering that this is a Load)
(ii) Extreme Under-Consumption for 73.3 hours (ROT >+30MW, remembering that this is a Load)
Those with access to the GSD2019 can flip to the ‘SHPUMP’ page in order to see more about the performance here, and how this maps with assessed Conformance Status.
(B2d) Darling Downs CCGT – ‘worst’ Gas-Fired Plant
In aggregate Darling Downs CCGT was the ‘worst’ performing of the 78x Gas-fired units operating in the NEM across CAL 2019 – seeing extreme ‘Raw Off-Target’ for a total of 49 hours across CAL2019, with:
(i) Extreme Over-Production for 26.1 hours (ROT <-30MW)
(ii) Extreme Under-Production for 22.7 hours (ROT >+30MW)
Those with access to the GSD2019 can flip to the ‘DDPS1’ page in order to see more about the performance here, and how this maps with assessed Conformance Status.
(B2e) Vales Point 5 – ‘worst’ Coal-Fired Plant
In aggregate Vales Point unit 5 was the ‘worst’ performing of the 48x Gas-fired units operating in the NEM across CAL 2019 – seeing extreme ‘Raw Off-Target’ for a total of 24 hours across CAL2019, with:
(i) Extreme Over-Production for 5.8 hours (ROT <-30MW)
(ii) Extreme Under-Production for 17.9 hours (ROT >+30MW)
Those with access to the GSD2019 can flip to the ‘VP5’ page in order to see more about the performance here, and how this maps with assessed Conformance Status.
(B2f) all of your favourite units!
… all of your favourite units are included in the GSD2019 so we’d invite you to access and explore!
(C) Split incentives
In terms of ‘Conformance Status’, assessed by the AEMO, it is our understanding that Semi-Scheduled plant are currently only assessed in a very limited number of occasions – because:
Limitation #1) A Semi-Scheduled unit can only be assessed as ‘Not Normal’ when the Semi-Dispatch Cap flag is on (i.e. and AEMO is requiring the DUID to pay attention to Dispatch Targets); and
Limitation #2) Furthermore, even in these instances, a unit can only be assessed as ‘Not Normal’ when its output is in excess of the Dispatch Target, with the Target acting like a Cap in the case of Semi-Scheduled units.
Hence on a large number of occasions, Semi-Scheduled plant are currently exempted from consideration of their Conformance Status (however this may need to be changing as this energy transition gathers pace).
When a Semi-Dispatch Cap flag is not set, the unit has almost* no responsibility for watching and following
* it’s important for readers (and particularly operators of Semi-Scheduled plant) to understand that deviations from target do still matter, at least in relation to the process AEMO uses for calculation of ‘Causer Pays’ allocation of Regulation FCAS costs.
In the GSD2019 we utilised a methodology developed by Greenview Strategic Consulting to calculate FCAS costs for Regulation Raise and Lower modeled on the ‘Causer Pays’ method and present these results by the relevant Registered Participant (as this is how the AEMO allocates them) and, where possible, by discrete DUID.
As Allan O’Neil has noted in his article also today, some Semi-Scheduled plant face FCAS recovery costs of the order of 10% of their total operating revenue (on some occasions, at some times, considerably higher!), which is a very unwelcome surprise to those Operators who have not yet worked out what Allan concludes at the end of his article:
… that the NEM is a market where details matter.
However even though the AEMO recovers some of the costs of ‘not following target’ through FCAS Causer Pays costs, the broader ability to not worry about ‘Conformance Status’ (such as in the case of Macarthur Wind Farm above, for instance) may well be delivering a false economy to the NEM. This raises questions for the future….
(D) Implications for the future
Once again let me reiterate that the results presented here should not be read:
1) As a criticism of wind and solar technology per se;
2) Neither is it a criticism of the operators of the assets.
As the Semi-Scheduled category allows these operators to be Off Target most of the time.
Indeed, it seems that the broader market has been structured even to encourage them, in some ways, to maximise the value they create for themselves with less consideration of keeping supply/demand in balance than would be the case for an operator of a Scheduled Generator (noting also that some Operators have a portfolio of both types of asset). This was part of what we wrote about in relation to the ‘the NEM has developed a “them and us” schism’ in Theme 5 within Part 2 of the 180-page analytical component within the GRC2018:
Readers here who are able to download the GRC2018 here should review what we wrote there, as the results presented in the GSD2019 seem (to me at least) to provide substantiation that this Schism is emerging, and that it is going to have a real impact on the success (or otherwise) of the NEM, and the broader energy transition, in the coming decade.
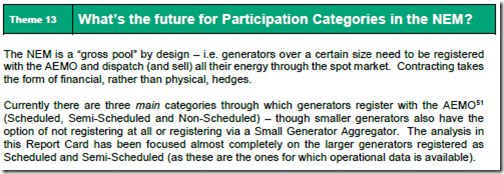
The results shown here also reinforce what we wrote about in Theme 13 within Part 2 of the GRC2018, where we posed questions about ‘What’s the future for participation categories in the NEM’:
Within that theme, we wondered about the future of the Semi-Scheduled category. The results presented for all DUIDs discretely in the GSD2019, and summarised above by fuel type reinforces our concern that the Semi-Scheduled category (as it currently operates) is neither scalable, or sustainable.
Unless it is substantially reformed (or potentially even abolished), the evidence suggests that the path towards ‘50% renewable by 2030’ and beyond looks quite rocky … and unnecessarily expensive. Are we fast approaching the time where incentives and actions should be much more closely aligned (both in terms of bid submission, but also in terms of following dispatch targets)?
It’s my understanding that there are moves afoot to deliver something like this in the near future…



Leave a comment