
Everyone would agree we’ve had too many days in recent summers where the NEM seems to be skating on the edge. The least of the many problems and headaches this causes is that the amount of data and analysis these events need to fully explain requires longer-than-real-time to process – at least for this analyst.
As a followup to Paul McArdle’s summary of events posted yesterday, this post looks in a bit more depth at some of yesterday’s events and drivers – all the while not trying to get distracted by whatever might be unfolding today, where it looks like NEM-wide demand might be heading towards all-time record territory. Apologies in advance for the fact that this is a bit of a rush and there’ll be more pictures and perhaps less explanation than usual. And plenty of areas I don’t get round to touching on.
Overview
For starters, a quick NEM-wide overview of demand, available generation, and 5 minute dispatch prices through yesterday afternoon & evening, highlighting the main features:
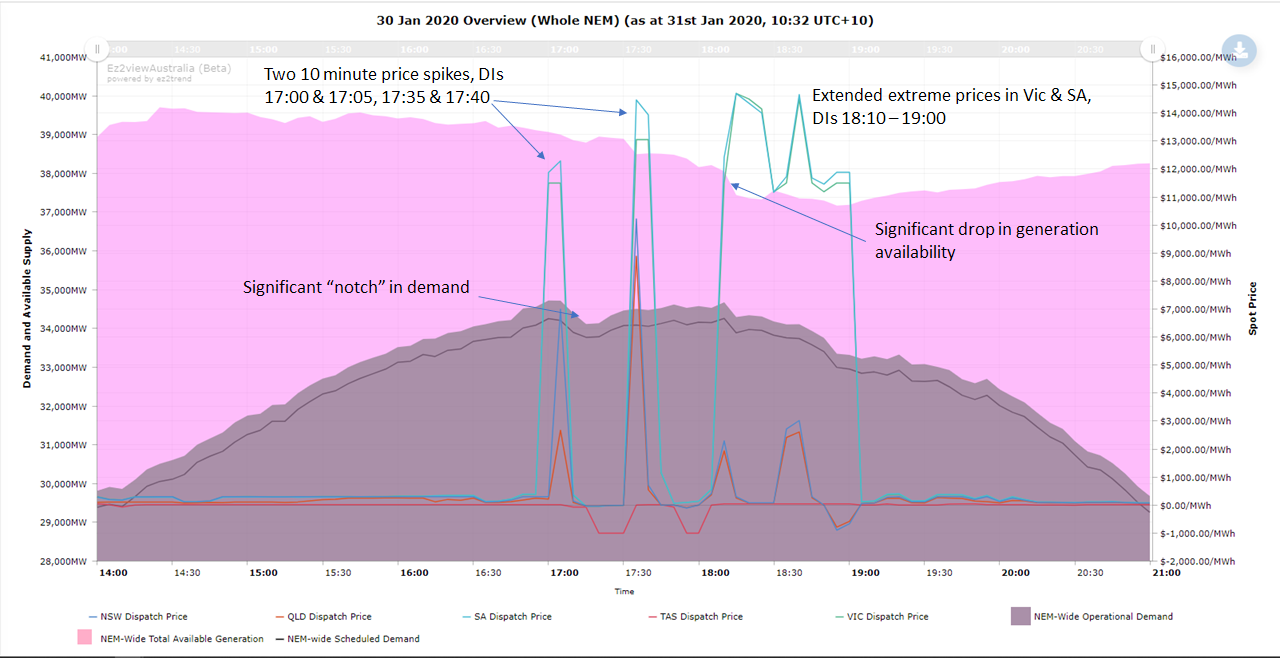
That “demand notch” could well have been some ‘informal’ (ie non-RERT) demand reduction in response to high prices – I haven’t had time to investigate further.
As outcomes were different enough in the southern mainland and northern mainland states, next up are two views showing demand, generation and price in those pairs (sorry Tasmania – but thanks for helping to keep the lights on with those solid exports on Basslink all day long!). First Vic+SA, showing available generation falling below demand, hence reliance on imports, especially when Loy Yang A3 tripped in DI 18:10-18:15 (NEM time):
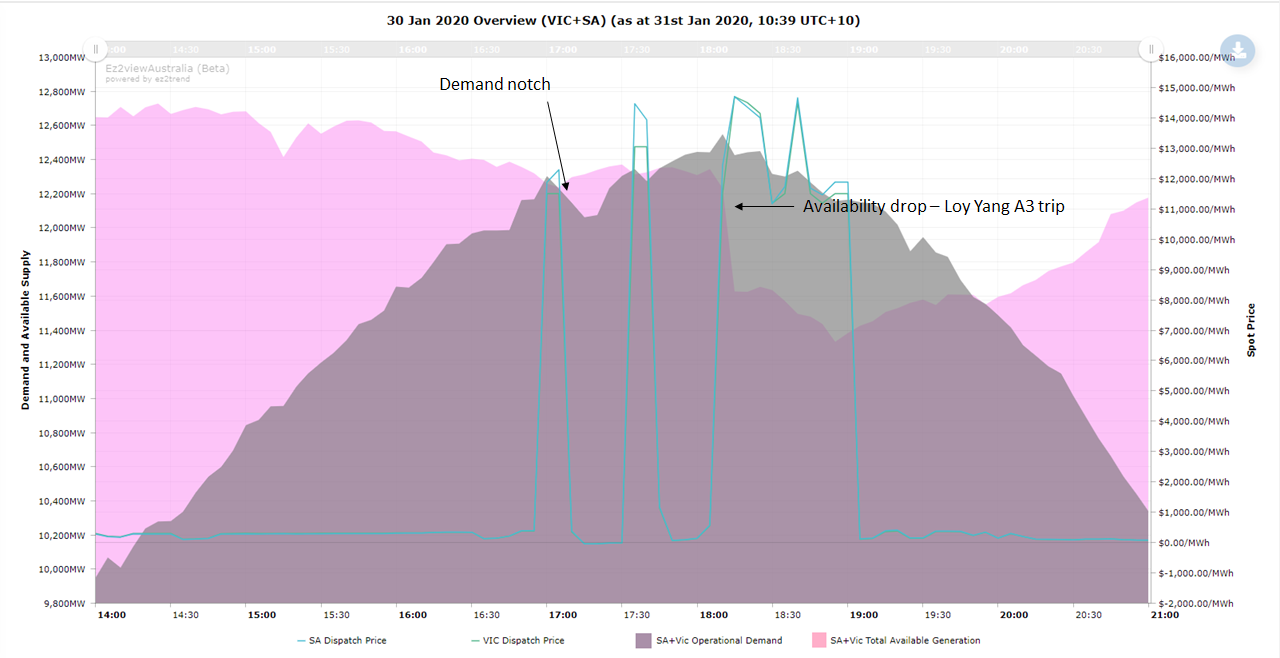
Those price spikes seemed to coincide with demand reaching or exceeding local available generation – but as the next chart for Qld+NSW shows, that’s not a necessary precondition for high prices:
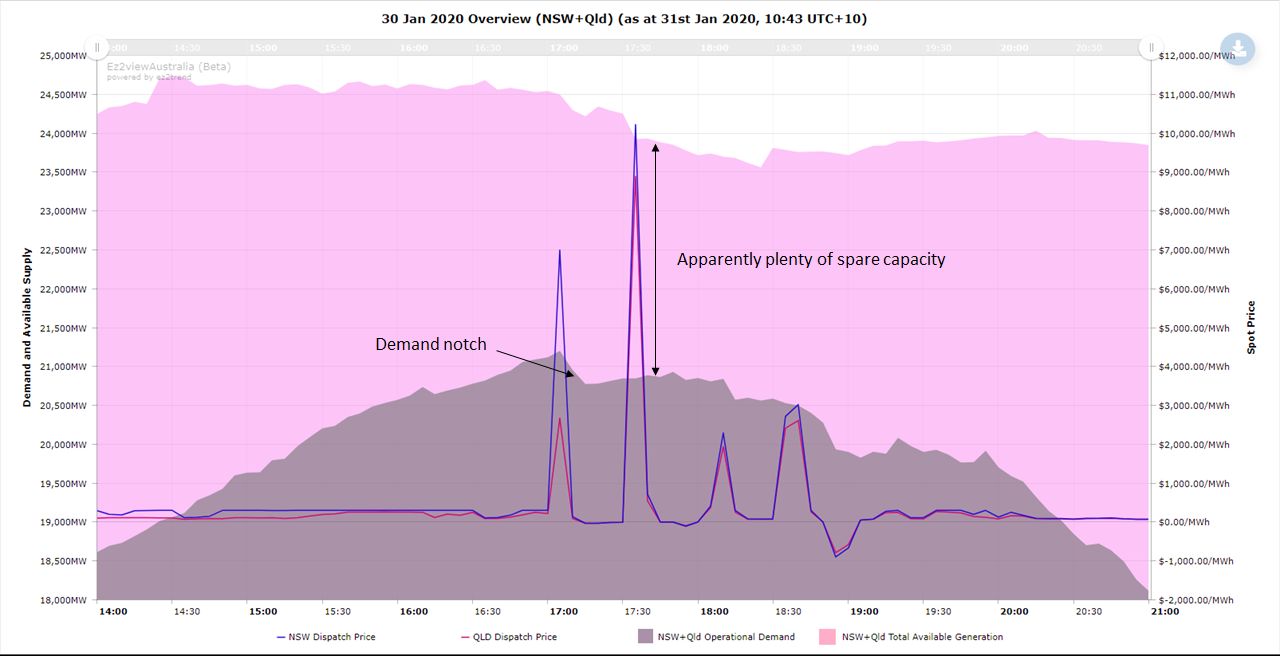
Price spikes despite an apparent 3,000 MW of “spare” generation, although remember that
- not all of Queensland’s spare generation could get to NSW if needed, due to interconnector limits
- as a pair, the two states were exporting to Vic + SA as well as satisfying local demand
Demand Evolution
Next some charts on how those high demands evolved through the day, as there seemed to be some “demand surprise” element to the fact that we got spikes around the afternoon / evening peak. First Victoria:
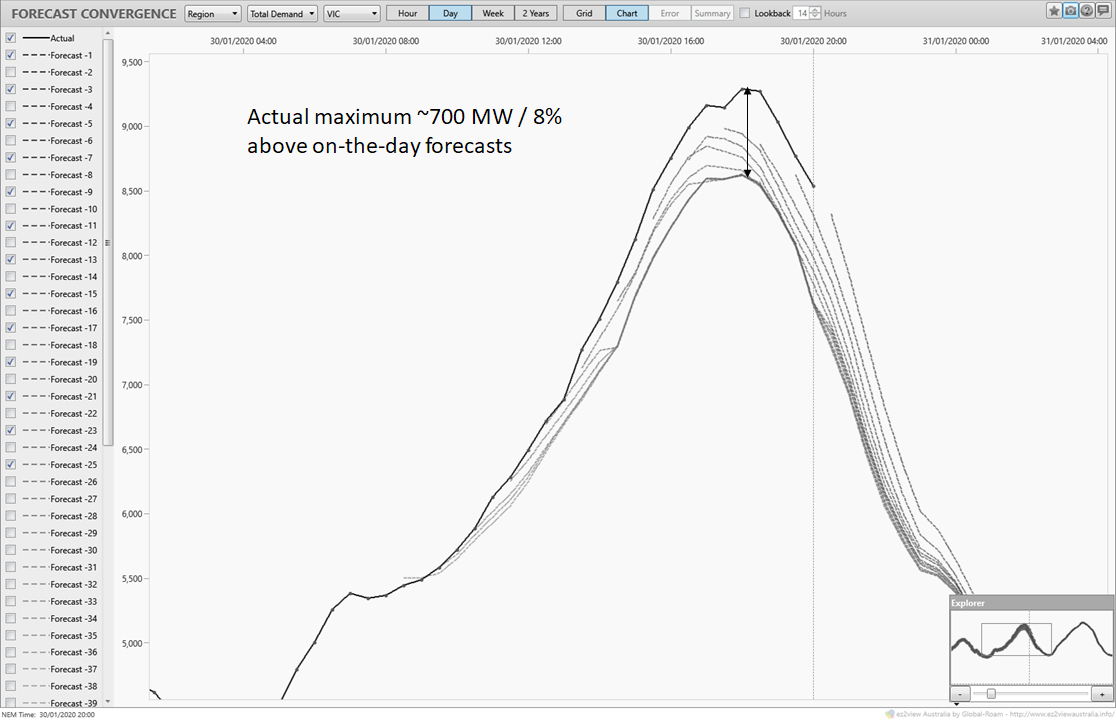
Here I’m showing hourly forecast updates issued from about 08:00 NEM time (9am local time), against actual half hourly demand outturn. Maximum half hourly demand exceeded initial on-the-day forecasts by around 700 MW, or 8%. That’s significant. Next up, charts for SA and then NSW:
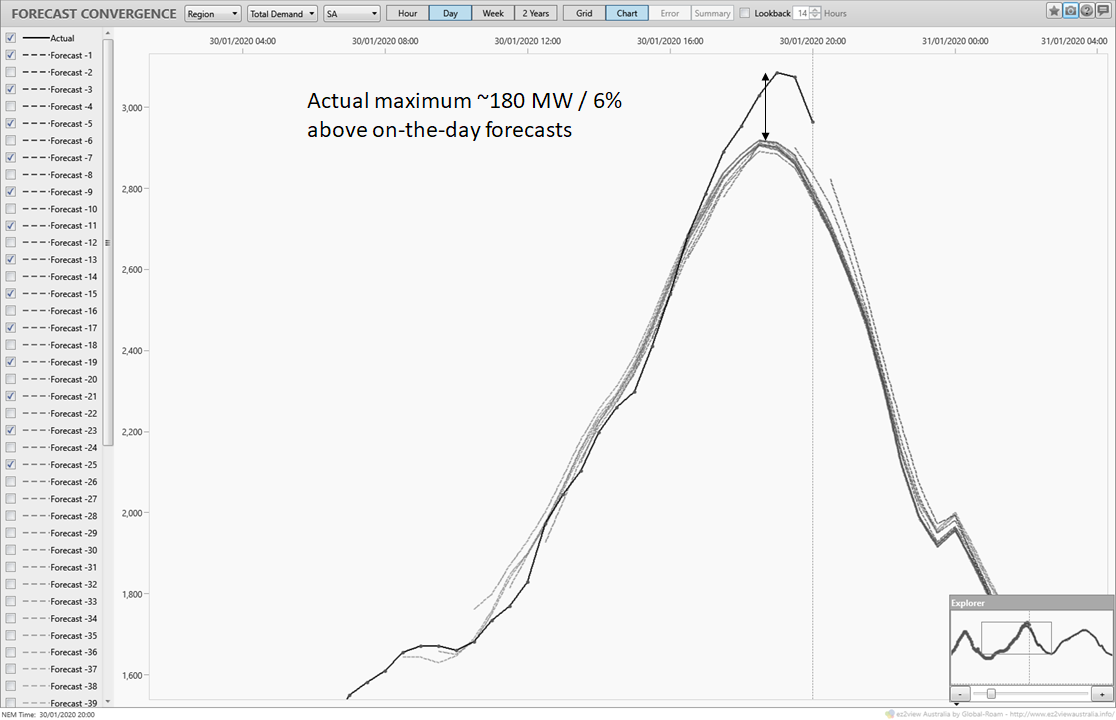
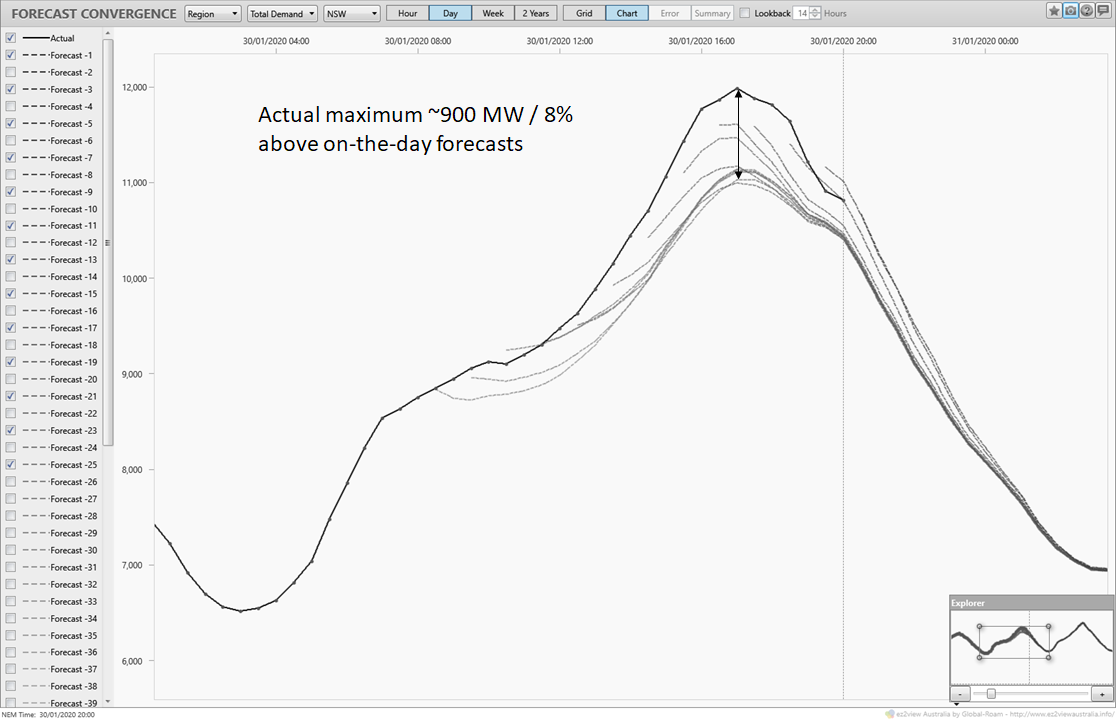
So across those three states, about 1,900 MW of higher demand than originally forecast (Queensland was fairly close to forecast). Perhaps being the first really hot days since businesses, schools etc swung fully back into gear after the Christmas break is part of the explanation.
Renewables Output
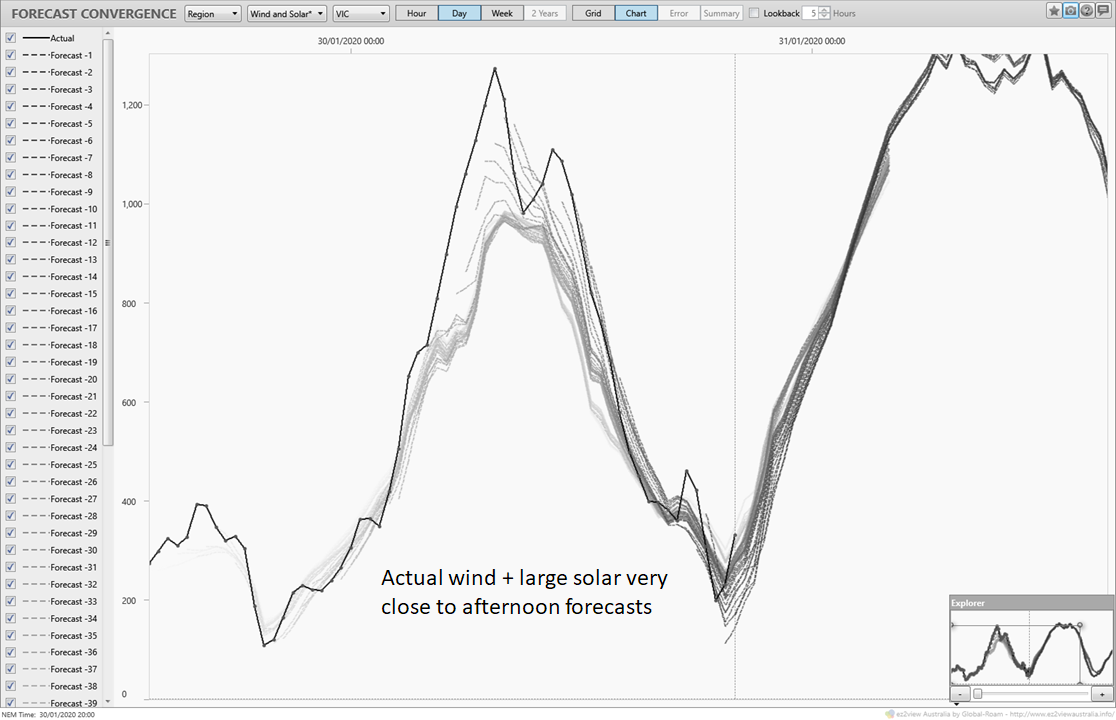
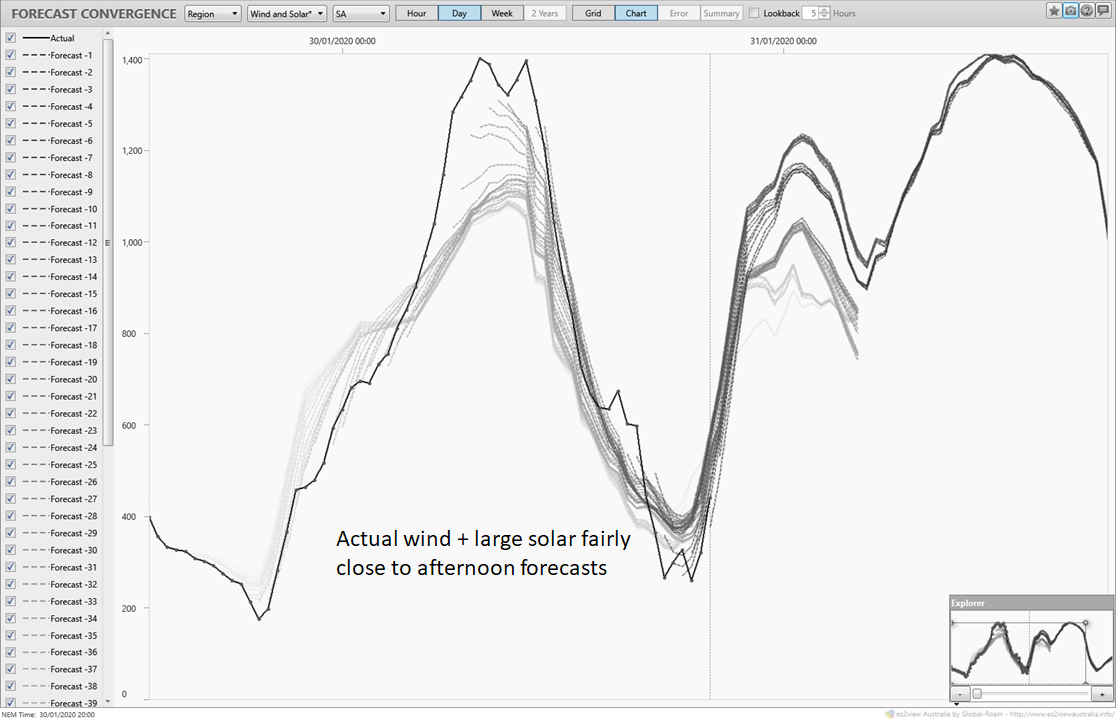
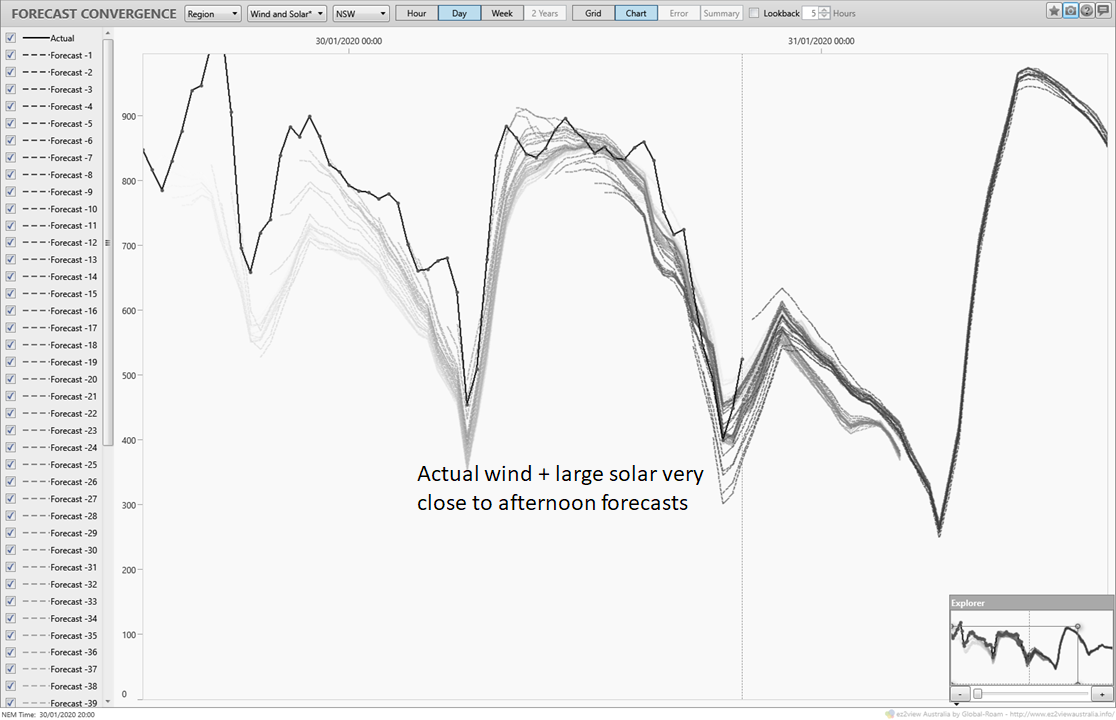
I’ve not had time to look at whether behind-the-meter small scale PV might have been down on typical or forecast levels for some reason (which would contribute to grid demand being higher), but the following charts for the four mainland regions show how large scale wind and solar output tracked through the day against AEMO’s forecasts. I have to say I’m pretty damn impressed with how well those forecasts capture changes through the afternoon; OK solar might be more or less predictable, but the forecasts did well in capturing the obviously falling wind speeds in SA, Vic and NSW:
Victoria:
South Australia:
NSW:
And solar-dominated Queensland:
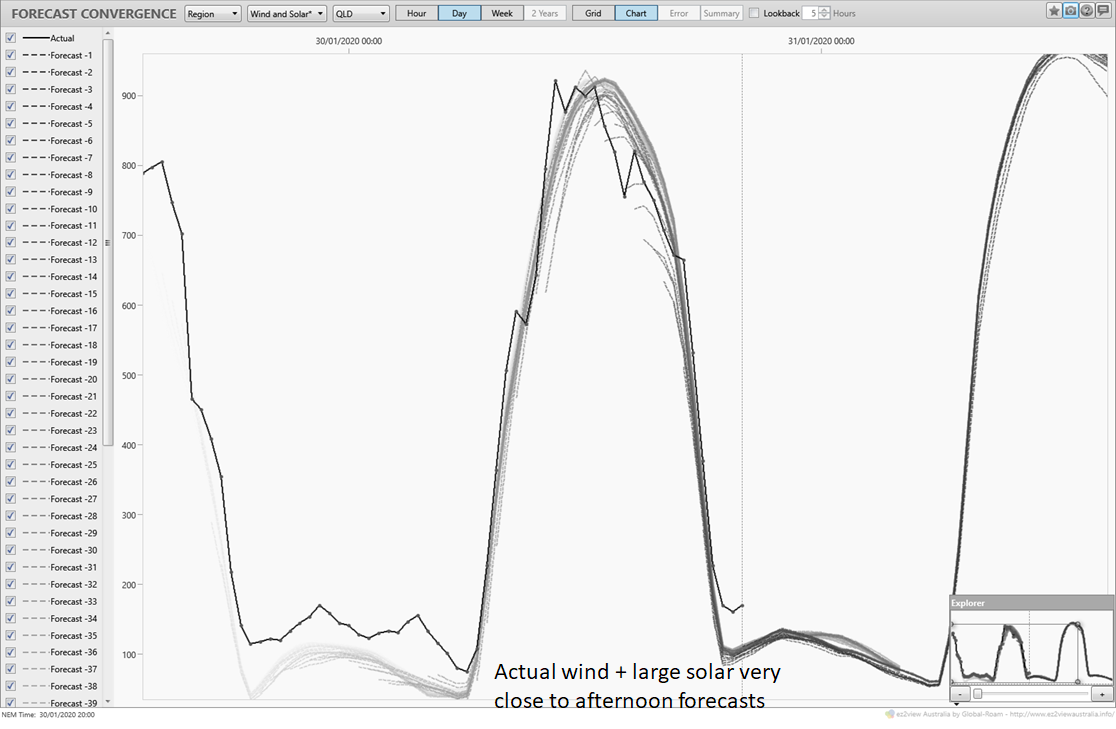
So overall, the conclusions are that renewables were falling away into the afternoon & evening peak, as expected and forecast given the hot, still weather conditions in Southern Australia and the setting sun. No real on-the-day surprises there.
Price Action
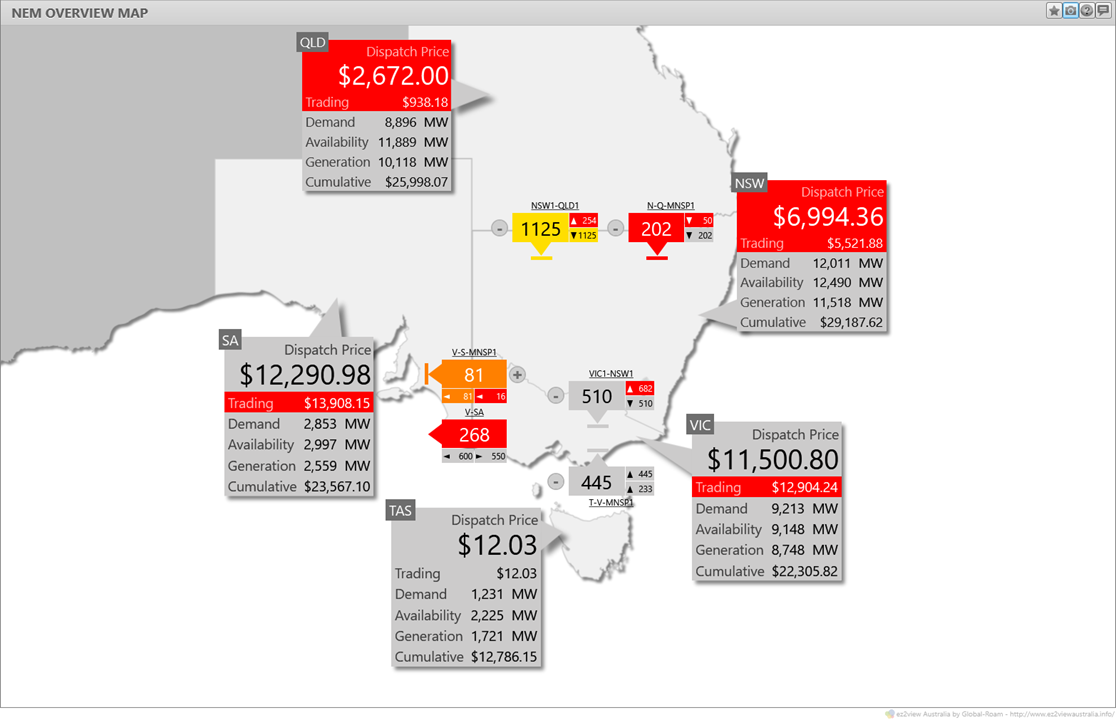
Now let’s jump to an overview of the market at DI 17:00 (18:00 AEST) when the first 5 minute spike appeared in Vic and SA:
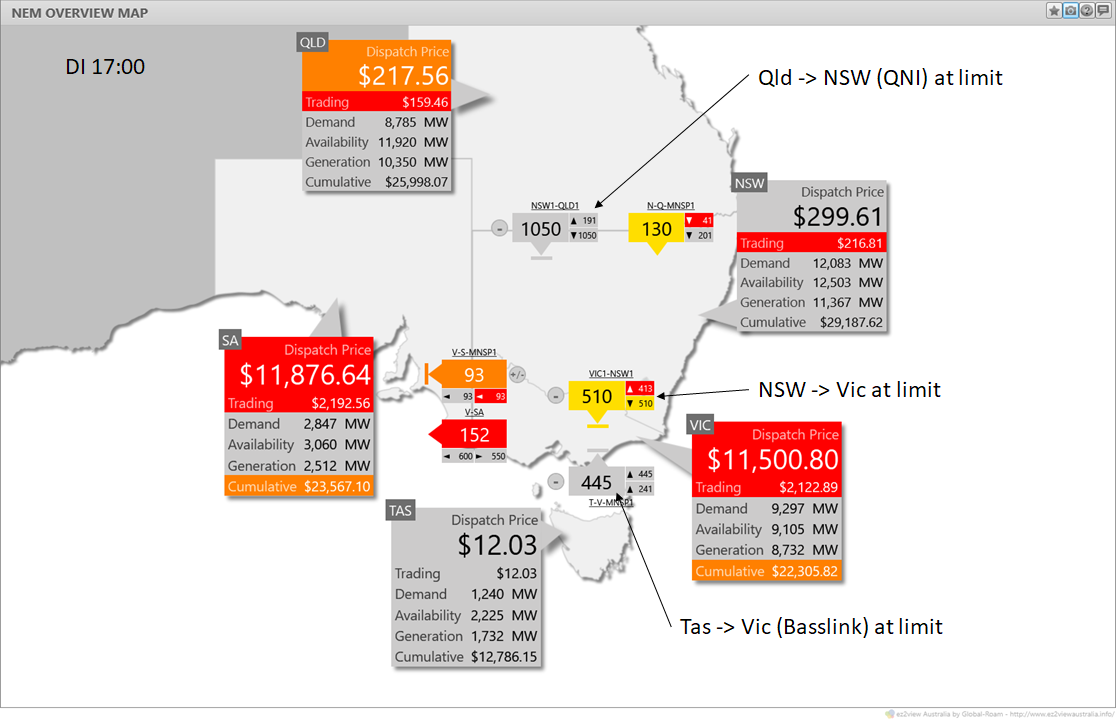
Here we see all the major interconnectors at limits of secure flow, and the southern regions’ prices in five digits. To see what drove the southern states’ price outcome, a look with ez2view‘s bid widget at aggregate Vic+SA generation offers:
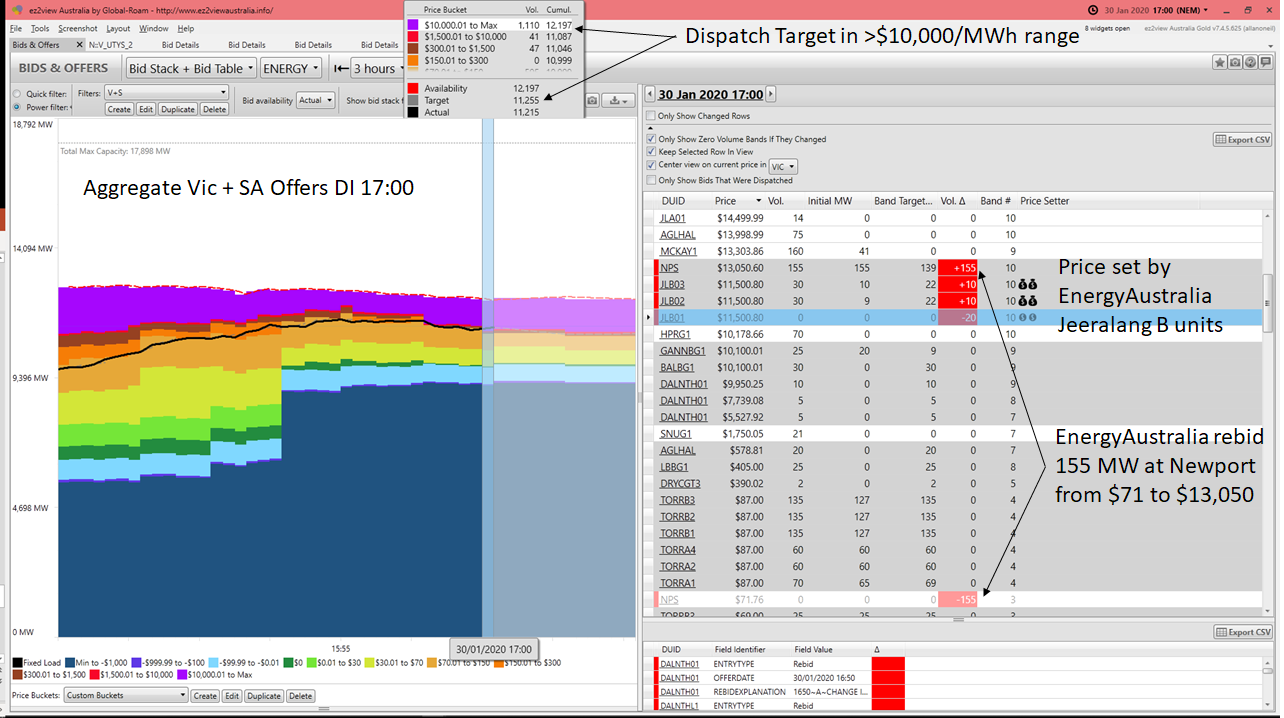
With no more flows securely available from the north, price is being set by Jeeralang units offering at $11,500/MWh. We can also see that just before this dispatch interval, EnergyAustralia also moved 155MW of volume previously offered at $71.76/MWh to $13,050/MWh. Hence the price jump.
In the next DI (17:05), NSW and to a lesser extent Queensland followed the southern price up:
What’s interesting here is that the four digit prices in Queensland and NSW are quite different from each other and from the southern prices. As NSW was economically isolated here (constrained interconnectors both north and south), let’s look at aggregate bids in that region:
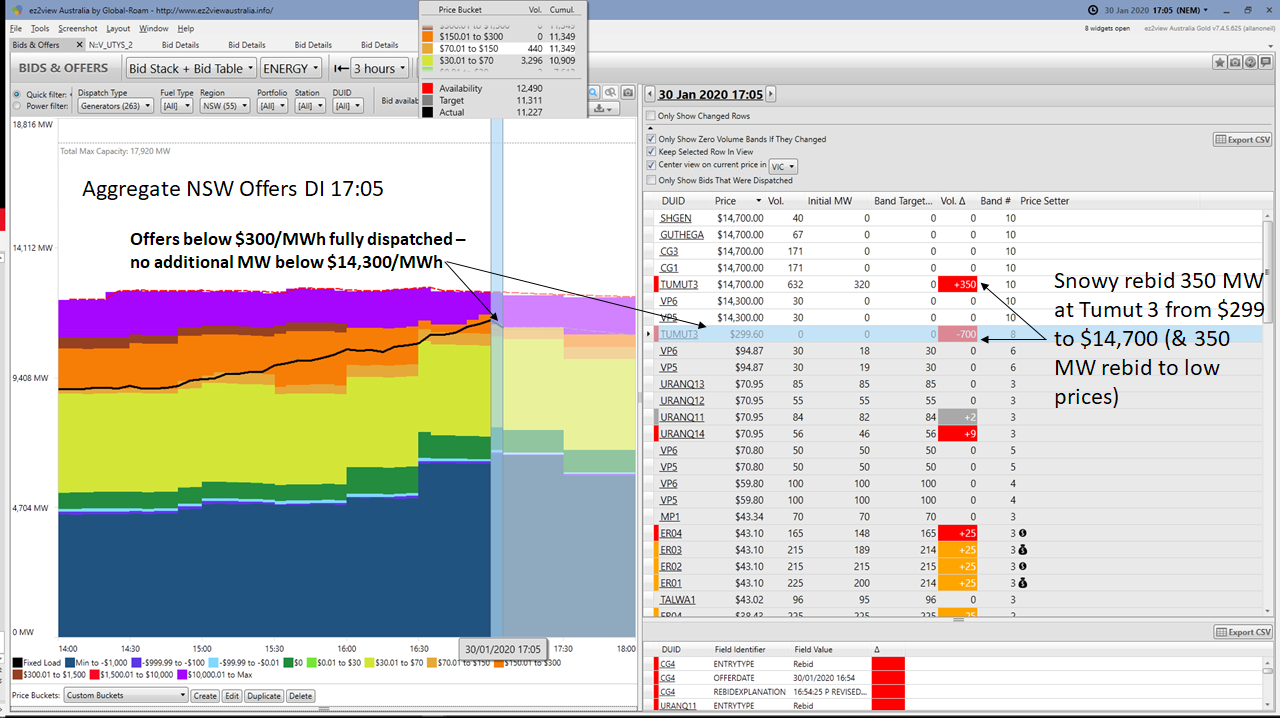
We can see a few interesting things here:
- Snowy at Tumut 3 had previously had 700 MW offered at just under $300/MWh, but in DI 17:05 half of that volume moved to $14,700/MWh and the balance to low prices. The net impact being less overall volume offered below $300/MWh
- The NSW bidstack contains no offers at prices between $100/MWh and $14,300/MWh – that is indeed thin
- Price in NSW of $6,994.36/MWh was not actually being set by any of these offers – how does this happen?
AEMO’s Price Setter data can “explain” – sort of:
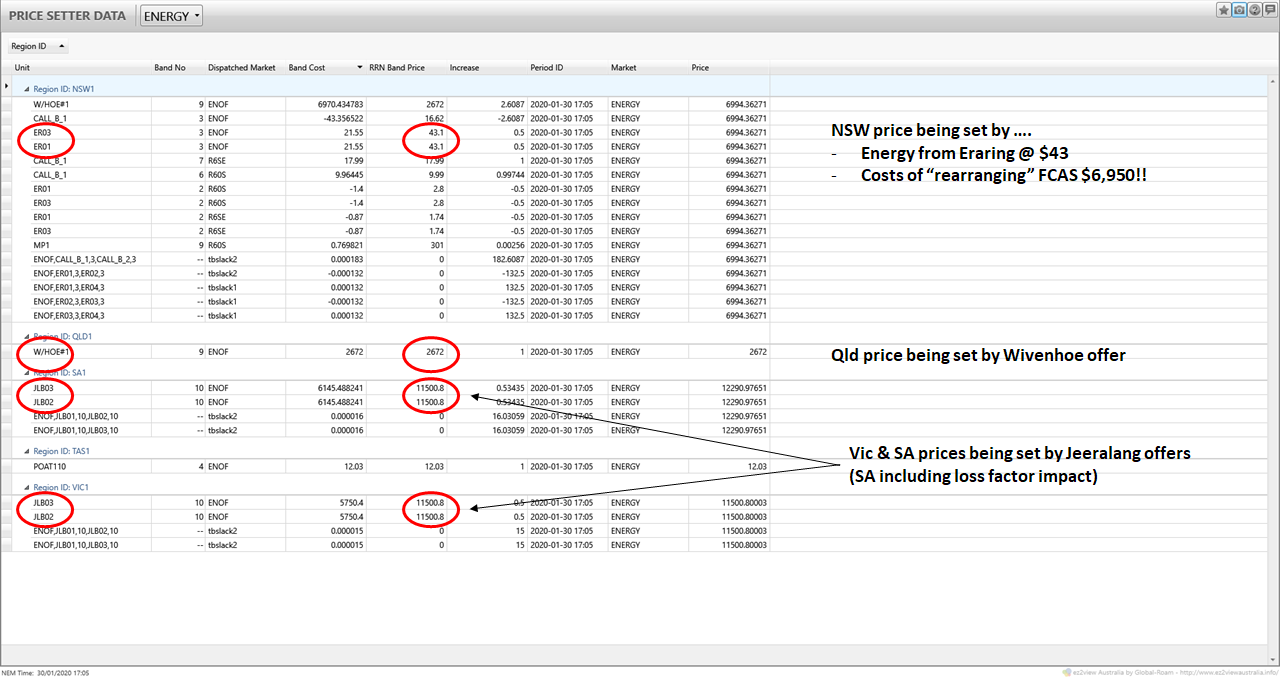
It would take more than a full article of its own to explain this really, but we can see that:
- Vic price is being set (as in the prior DI) by Jeeralang units
- SA price also, factoring in the effect of losses across the Vic-SA interconnector
- Qld price is being set by a Wivenhoe offer at $2,672/MWh
- the NSW price though is a mind-bending shandy of energy price offers and FCAS bids. In effect, the cost of producing the marginal unit of energy in NSW involves rearranging dispatch on a bunch of different units around the NEM and the all up cost of that is $6,994/MWh
As partial support for this interpretation we can look at the price setting for FCAS Raise 6 service which was in short supply across the NEM in this DI:
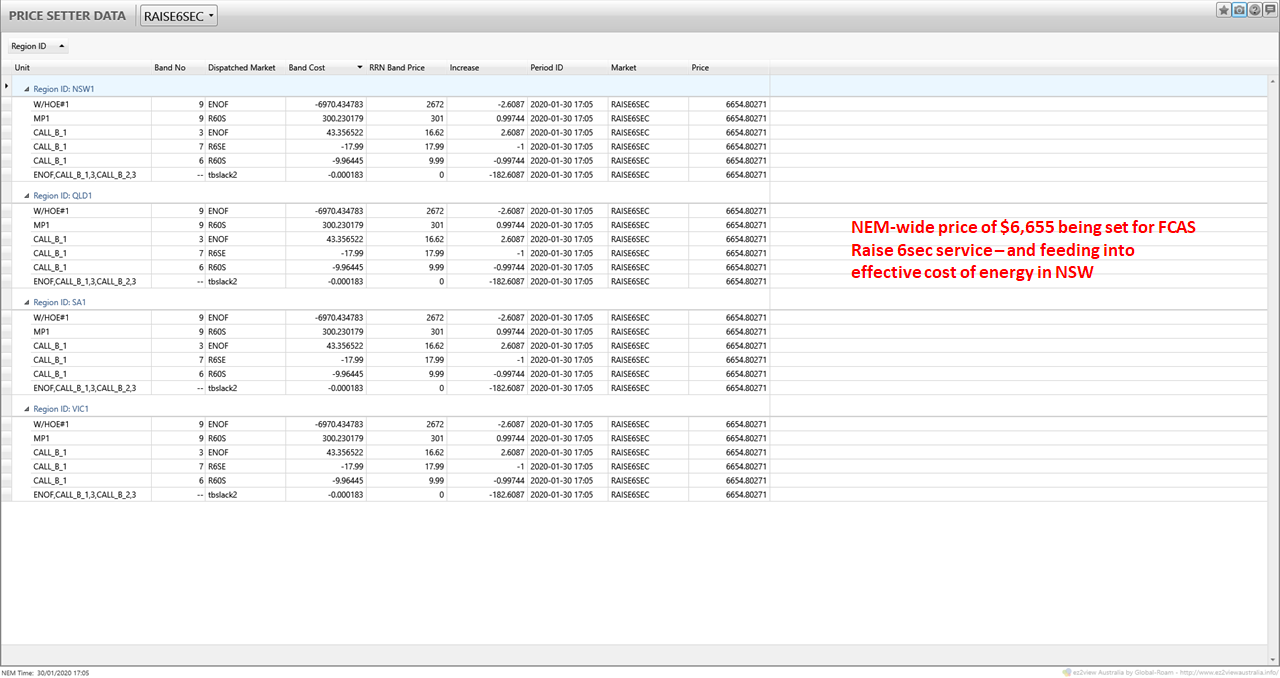
Just one of the strange things that can happen when supply gets tight in the NEM.
Interconnector Constraints
Back to something slightly less arcane, what was limiting exports from NSW into Vic and SA, contributing to the tight supply there and the subsequent high prices?
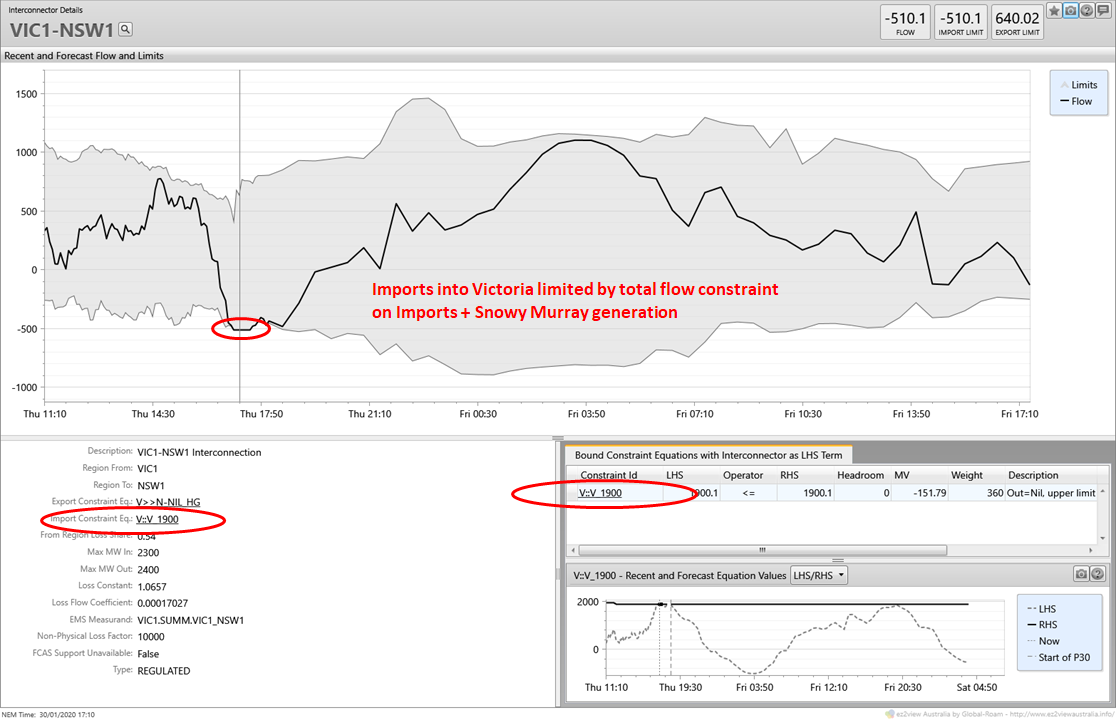
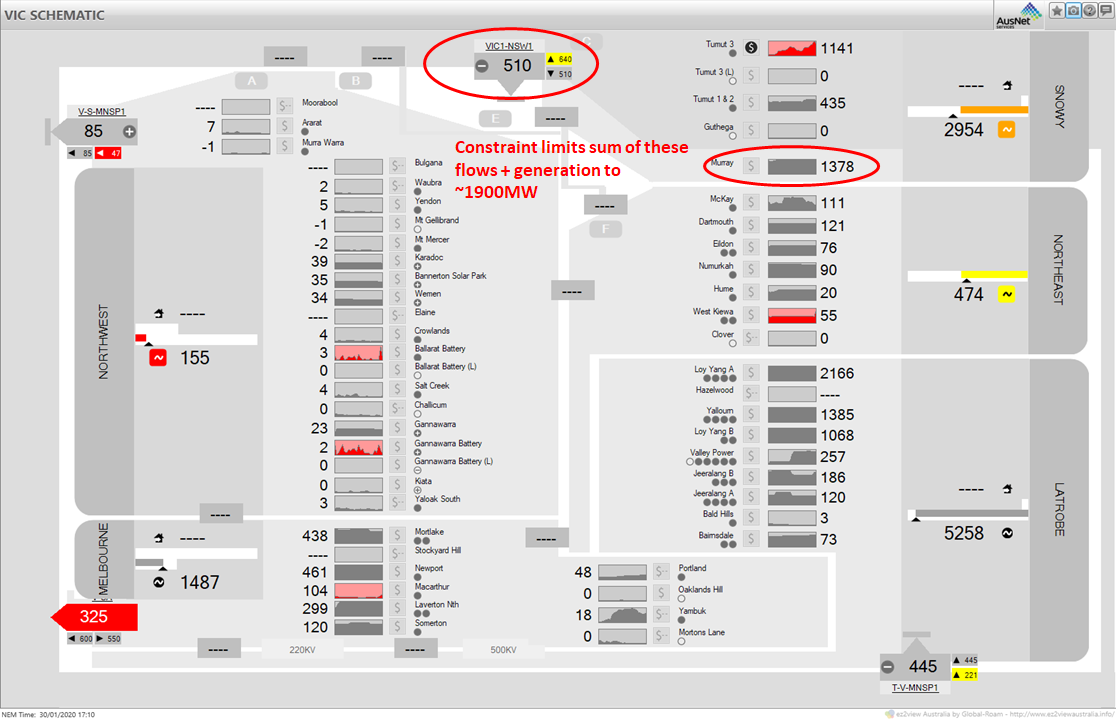
Without going into the full detail, the relevant transmission security constraint limits to 1,900 MW the total flows that Victoria can import from NSW and Snowy’s Murray generation (geographically in NSW, but deemed to be a Victorian generator for NEM purposes). When Murray is running hard, as it was yesterday, only so much capacity is left for imports from the rest of NSW:
This highlights a key reason why more transmission capacity between NSW and Victoria will be required in order for the southern states to access extra net capacity from the Snowy 2.0 project when that finally gets built.
Free-flowing Four & Five Digit Prices
This is really just a piece of NEM trivia, but looking at the 17:35 price spike showed a fairly rare situation with high prices in every mainland state and no major interconnectors actually constrained (although getting close):
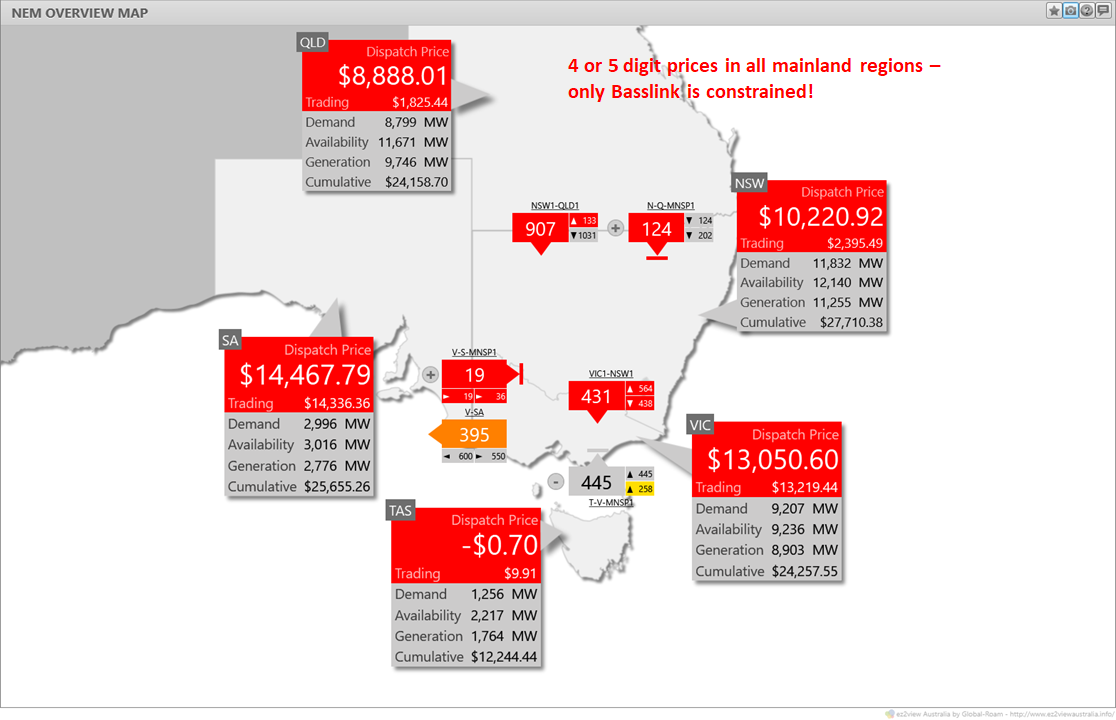
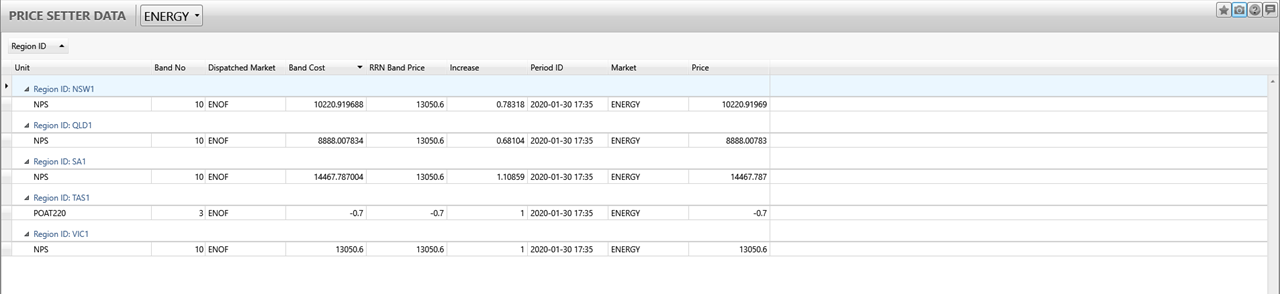
And while those prices all look different, the Price Setter data shows they are all being set by a $13,050/MWh offer at EnergyAustralia’s Newport, with interconnector loss factors responsible for the variation:
Loy Yang A3 Trip
I’m guiltily aware of having run out of time to do this any justice even though it caused the longest price spike of the day, declaration of LOR2 in Victoria and South Australia, and set AEMO hunting for RERT reserves to provide additional safety margin (in the event, none were activated yesterday before falling demand and increasing wind restored reserves and ended the LOR2). All I’ll show is what the picture looked like in the DI where output from LYA3 disappeared:
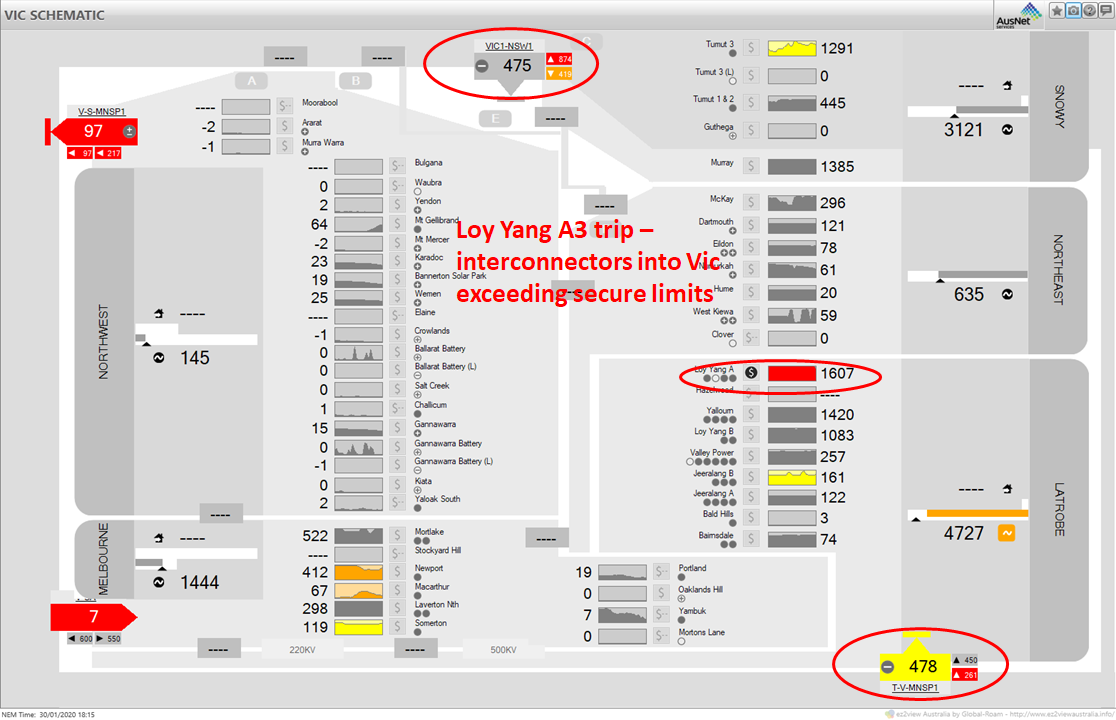
NEMDE was forced to schedule interconnector flows somewhat exceeding secure levels, until other generators in the south were able to ramp up and replace the missing output.
Fortunately LYA3 was back on again this morning, otherwise Jan 31 would have turned out to be even more challenging than it undoubtedly was!
About our Guest Author
 |
Allan O’Neil has worked in Australia’s wholesale energy markets since their creation in the mid-1990’s, in trading, risk management, forecasting and analytical roles with major NEM electricity and gas retail and generation companies.
He is now an independent energy markets consultant, working with clients on projects across a spectrum of wholesale, retail, electricity and gas issues. You can view Allan’s LinkedIn profile here. Allan will be sporadically reviewing market events here on WattClarity Allan has also begun providing an on-site educational service covering how spot prices are set in the NEM, and other important aspects of the physical electricity market – further details here. |
Leave a comment