
Considering the extraordinary weather, bushfires, and a couple of large Victorian generators still not back from long term repairs, last week was probably less eventful for the NEM than might have been expected, but it certainly wasn’t incident-free. A very industrious Paul McArdle somehow found the time to cover in considerable depth a couple of the big days in South Australia (Thursday) and Victoria (Friday), along with a detailed look at the forecast LOR2 conditions in Victoria on Wednesday – which ultimately didn’t eventuate.
What, you may ask, is “LOR2” anyway? A quick reminder below of what AEMO’s Lack of Reserve categories mean (or click here for another take):
| LOR3 | Most severe Lack of Reserve condition. Forecast LOR3 means that AEMO projects that in some future period, involuntary load shedding will be necessary to maintain system security in at least one NEM region. Actual LOR3 means that involuntary load shedding is currently occurring. |
| LOR2 | System is currently (Actual LOR2), or is projected in a future period to be (Forecast LOR2), just one contingency away from LOR3 – load shedding. A “contingency” is generally loss of a major generator or transmission element. |
| LOR1 | System is currently (Actual LOR1), or is projected in a future period to be (Forecast LOR1), one contingency away from LOR2, and thus two contingencies away from load shedding. |
The key thing about LOR2 (and of course LOR3) conditions is that AEMO seeks to avoid their actual occurrence wherever possible; in the first instance by alerting participants and seeking “market responses” – such as generators offering in more capacity where available. If insufficient response is forthcoming as the time of projected LOR2 approaches, AEMO may intervene in the market and take actions such as directing participants to provide extra capacity if feasible, or preparing for voluntary load shedding under RERT arrangements, in order to keep the real time supply-demand balance outside LOR2 territory. AEMO will strive not to run the system in an actual LOR2 condition for any length of time if there is a feasible alternative.
So forecasts of LOR conditions are very important steps along the path of AEMO alerting participants to possible system security risks, encouraging market responses, and preparing for intervention if ultimately necessary.
Which is why it was surprising to say the least to see AEMO declare actual LOR2 conditions for Victoria at 17:19 NEM time (6:19 PM local time) last Friday, when no earlier announcements of forecast LOR2 had been made, and only a small dip into LOR1 territory had been forecast for the hour between 17:00 and 18:00 (NEM time, which I’ll use from hereon in) . Paul’s excellent timeline sets out the full sequence of notices in detail.
The underlying factors that drove the supply demand balance into LOR2 territory are pretty clear, and were well covered in Paul’s analysis
- extreme temperatures and high demand in both Victoria and South Australia, notwithstanding that demand was lower than it might have been had the same conditions occurred a week or two earlier, before some schools and businesses had wound down for Christmas
- the two large Victorian generators still on outage
- falling output from Victorian windfarms across Friday afternoon
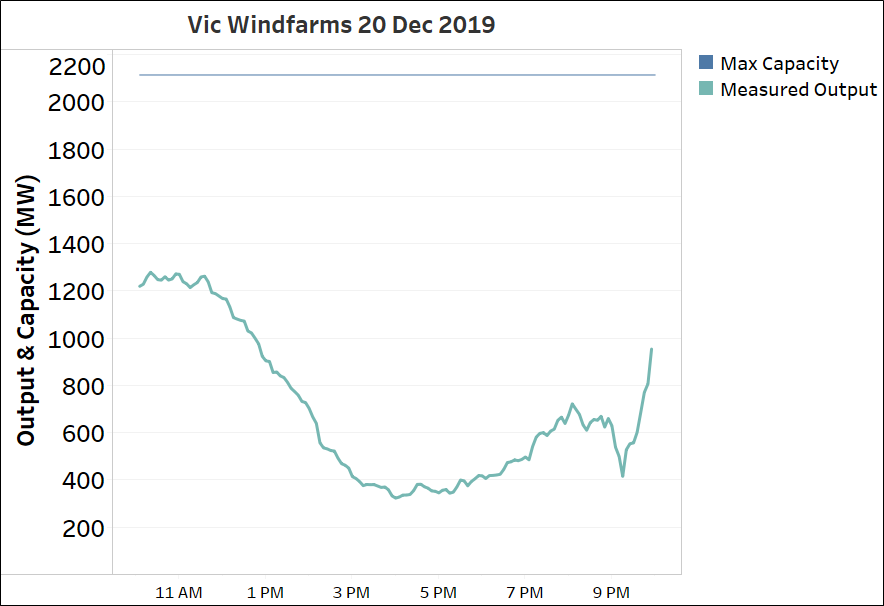
The last point was a surprise, not because windfarms are designed or typically expected to provide any particular level of output at times of high demand – unlike dispatchable generation – but because it was a reasonably windy afternoon and forecast levels of windfarm production had looked solid that morning, leaving the market looking well supplied despite the heat and outages. We can see the extent of the drop after about midday in the following chart of aggregate Victorian windfarm output for Friday.
More detailed data and analysis at individual windfarm level will be needed to confirm the extent, but the major culprit behind the falling output was almost certainly not wind strength unexpectedly dropping away, but instead some major wind generators derating due to the extreme temperature conditions, and significantly reducing their maximum output capability regardless of wind strength. Hence AEMO’s reiterated pleas for generators to update their actual capability under extreme heat conditions, noted in Paul’s followup post.
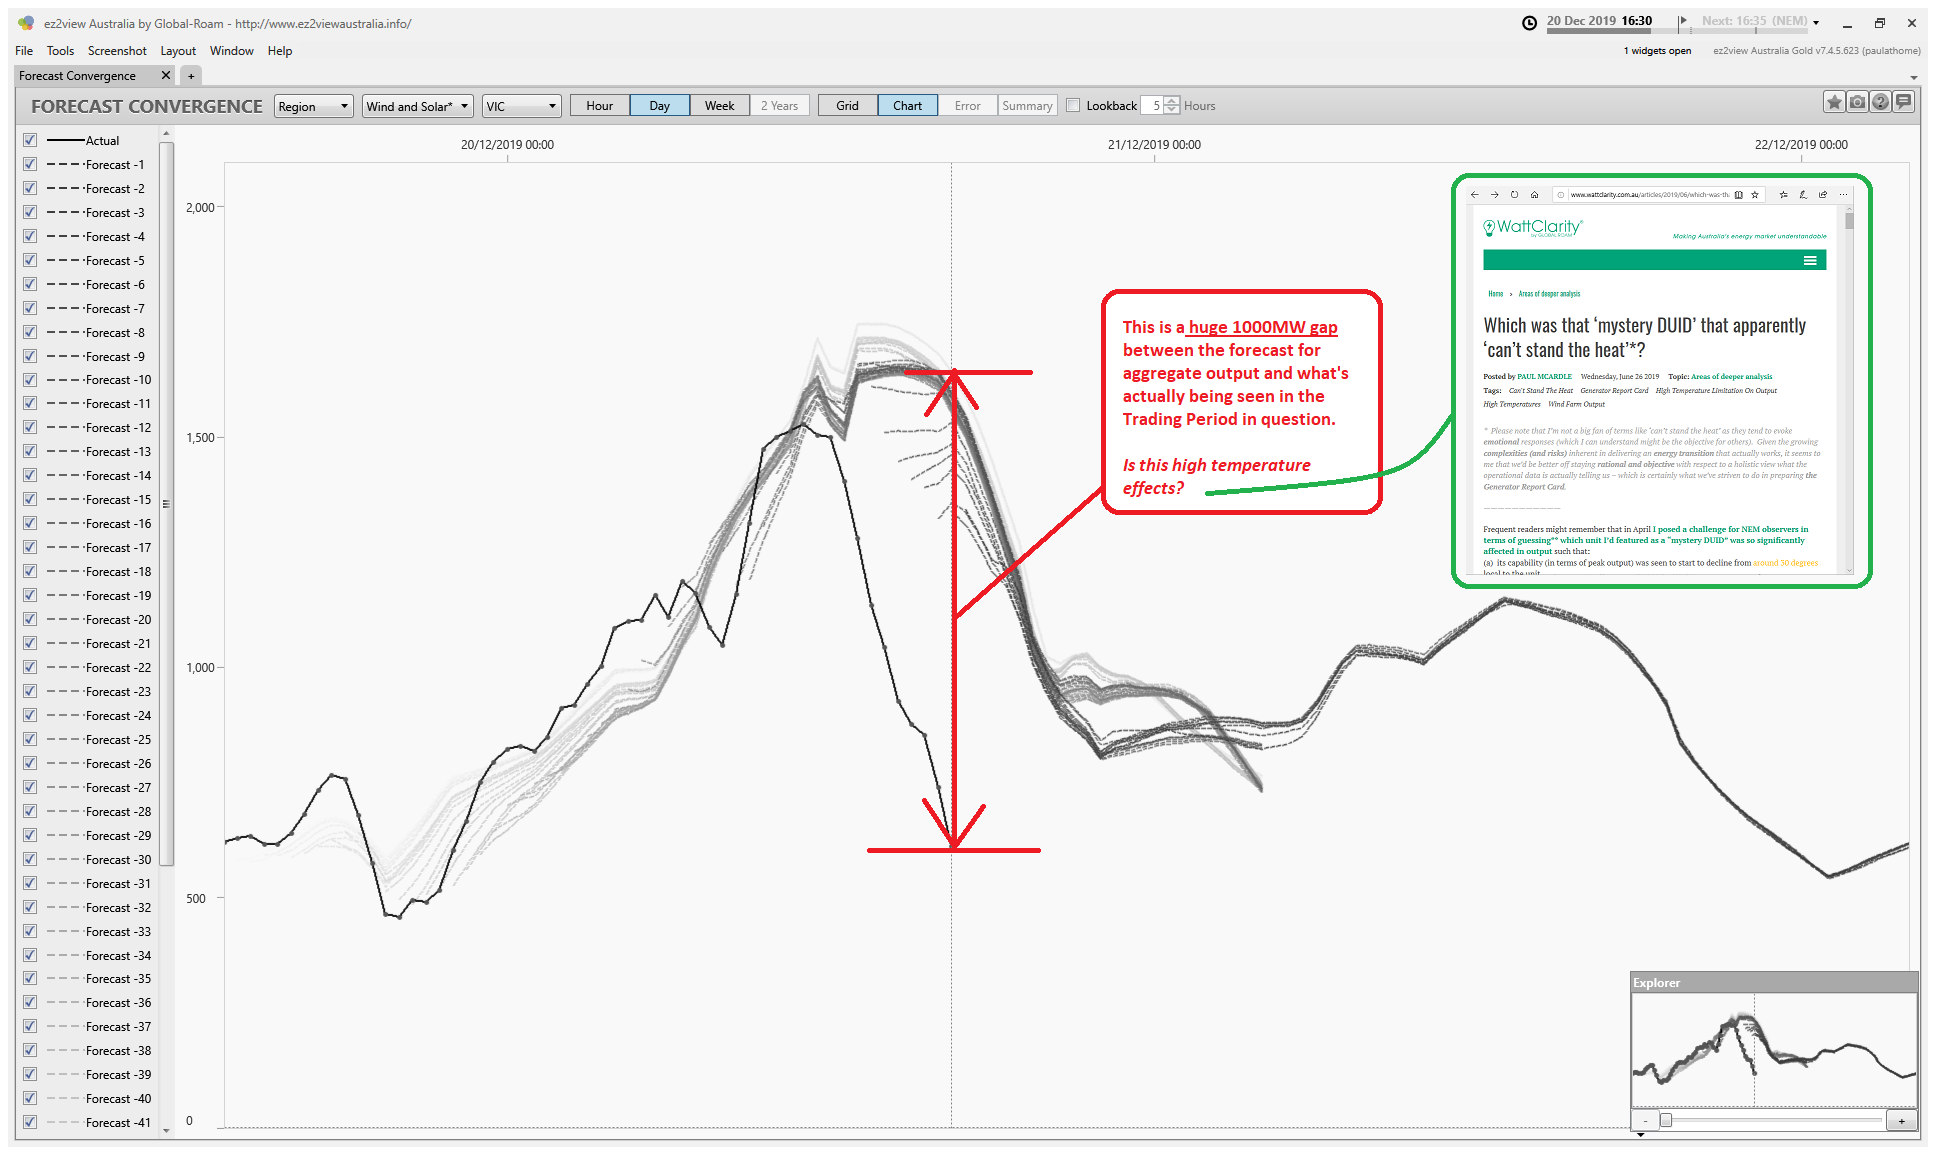
Paul’s prior post included this much busier chart which highlighted a massive-looking gap between forecasts of wind (and solar) output and what actually unfolded through the afternoon. Solar farms generally produced as expected, so the gap here was basically all down to wind forecasts vs actuals:
Now, the key thing you have to know if you plan to spend some of your Boxing Day reading any more of this post is that AEMO doesn’t produce just one set of forecasts for windfarm (and solar farm) output, but at least four (and the table below excludes some variants of these):
| Granularity & Horizon | Used In | Description |
|---|---|---|
| Half hourly, ~6-7 days | STPASA | STPASA (Short Term Projected Assessment of Supply Adequacy) process assesses physical supply-demand balance (LOR conditions) from 1-2 days ahead out to 6-7 days. Half hourly aggregate projections for wind+solar based on farm availability and weather forecasts. Updated every 3 hours. |
| Half hourly, <1-2 days | PDPASA PD30 |
PDPASA process mirrors STPASA for current day and (after 12:30) following day. Half hourly aggregate projections for wind+solar based on farm availability and weather forecast.Updated every half hour. PD30 process (30 minute predispatch) projects market dispatch volumes and prices, based on same underlying half-hourly wind+solar forecast (+bids). Updated every half hour. |
| 5 minutely, 1 hour (wind / solar aggregated) |
PD5 | PD5 process (5 minute predispatch) mirrors PD30 but at 5 minute granularity for the next hour only. Updated every 5 minutes. |
| 5 minutely, (individual farms) |
Dispatch | Real time market dispatch for each individual semi-scheduled wind or solar farm uses a 5 minute ahead forecast of farm availability (expected maximum output). This has historically been supplied by AEMO’s forecasting systems, although recent capability has been added for participants to supply their own forecast.
This availability forecast is generally the output level the farm is expected to provide by the end of the 5 minute dispatch interval. Under constraint conditions, or if the farm has offered some of its energy at higher prices than the spot price, it may be given a semi-dispatch target lower than its availability. |
The whole point of this post (and yes it’s taken a while to get here) is that under Friday’s unusual conditions, and for a variety of reasons which aren’t entirely clear, these sets of forecasts diverged very markedly and that divergence was almost certainly the key factor in the sudden declaration of Actual LOR2 with little or no prior warning.
Thing is, if AEMO’s market dispatch engine (NEMDE) had been relying on the same forecasts shown in Paul’s chart, and assumed that windfarms would produce to those levels every five minutes, the market would have gone into major convulsions much earlier in the day. NEMDE balances supply and demand at 5 minute intervals, and a gap in NEMDE’s calculations due to wind output being 5-600 MW lower than assumed would have had dire consequences for real time dispatch, which we obviously didn’t see.
By digging into the 5 minute dispatch data, we can extract the actual availability levels – 5 minute ahead farm-level forecasts, per the last line of the table above – which NEMDE was using for Victorian wind and solar farms. I’ve charted these below in aggregate, along with actual physical output levels achieved:
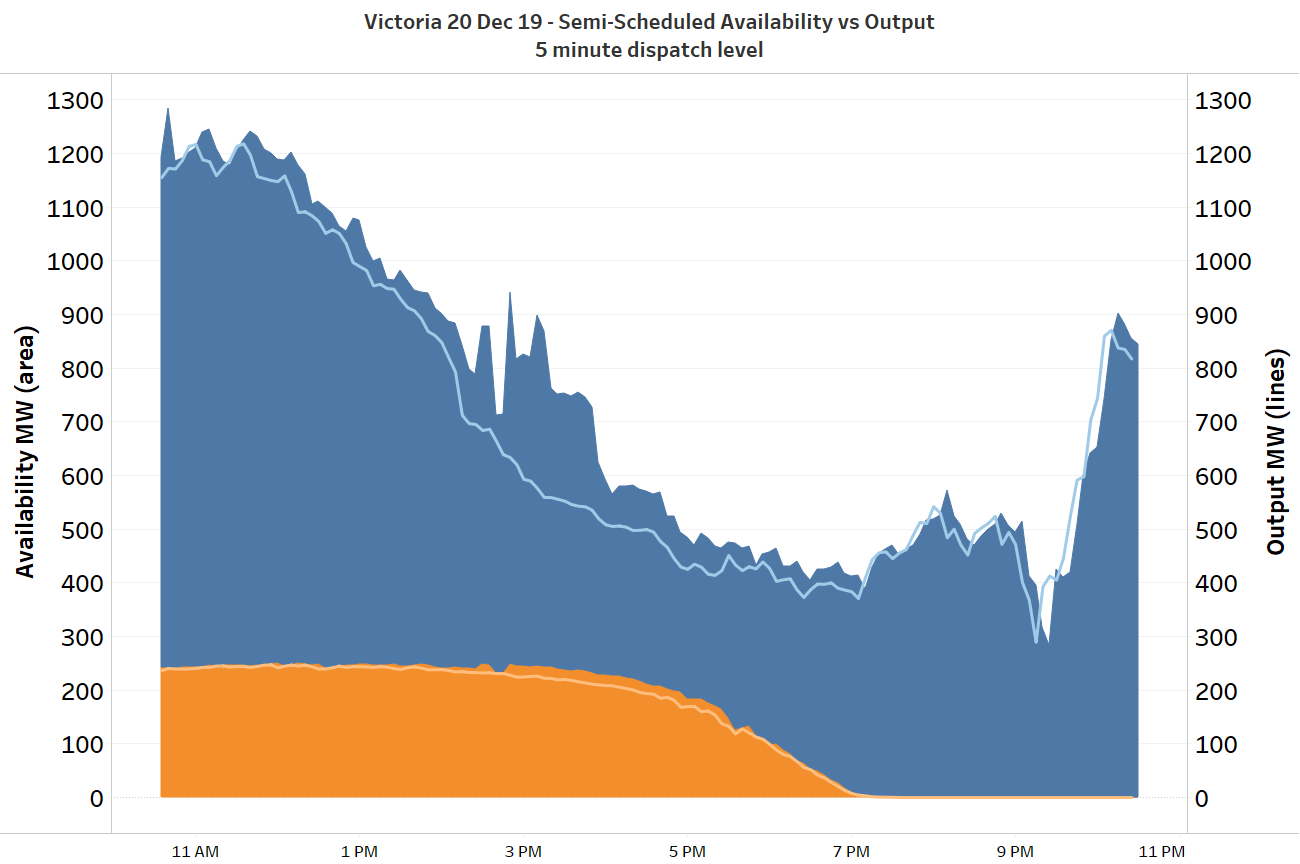
This shows that NEMDE was in fact using farm availabilities which in aggregate were much closer to the actual output levels achieved – but note some upward spikes in availability between about 14:30 and 16:00 NEM time.
By excavating further down to individual farm level, we see where those spikes were coming from:
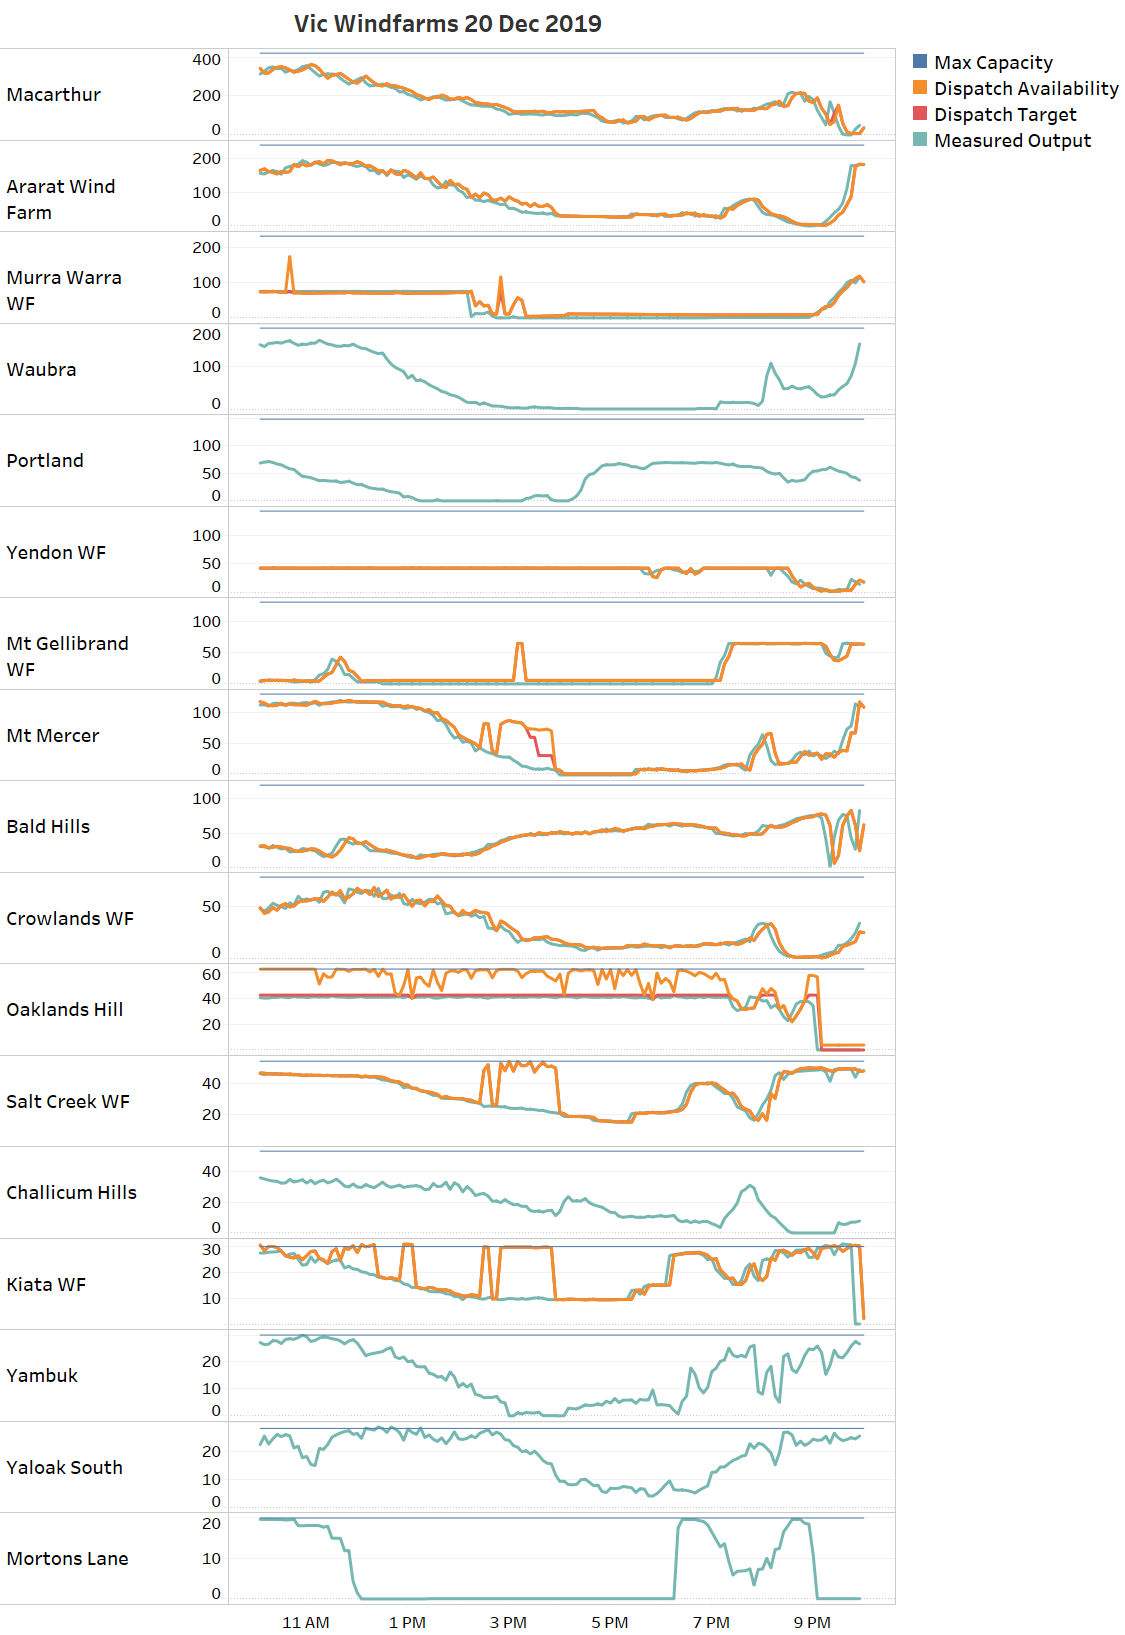
(Note this chart also shows output from older non-scheduled farms, for which an explicit availability target isn’t set. However forecasts for these farms are still used in all the processes listed above and appear to have followed similar patterns to the newer semi-scheduled farms.)
It’s clear on this chart that forecast 5 minute dispatch availabilities for many farms basically tracked their actual – falling – output during the afternoon, but there are a number of exceptions like Murra Warra, Mt Mercer, Kiata, Salt Creek and briefly Mt Gellibrand where forecast availability spikes up in the 14:30-16:00 window. We can also see Oaklands Hill being constrained down consistently below its forecast availability throughout the day – the result of an individual network constraint.
It appears from this chart that most real time windfarm availabilities being used in 5 minute dispatch were being driven not by forecasts derived from wind speed and turbine power curves (known as “energy conversion model” or ECM-based forecasts), but by so-called “persistence” forecasting based off actual observed outputs. The jumps in dispatch availability for some farms may represent the forecasts switching between this mode and ECM and then back for some reason – but I’d be speculating on this.
The obvious question though is why the longer time horizon 30 minute forecasts being used in AEMO’s PDPASA and PD30 processes – which are the ones shown in Paul’s chart – became disconnected almost completely from what was happening in the real world across the afternoon. I’ve prepared this somewhat busy chart that tries to bring together this whole forecasting disconnect in one picture:
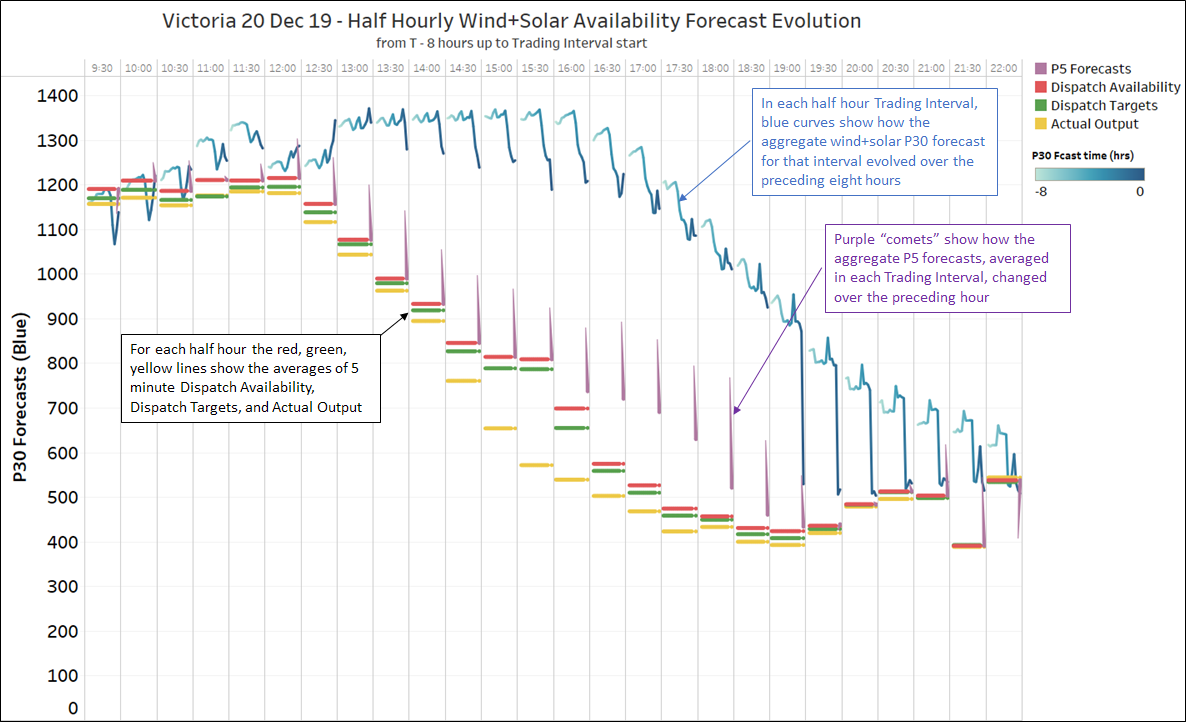
What’s clear here is that from about midday onwards, the progressively falling actual output and real-time 5 minute availability level for windfarm output had very limited impact on the forecasts at 30 minute granularity, until the last P30 forecast for the 19:00 trading interval (made at 18:30), where the sudden tick down in the forecast brings it much closer to actual output levels.
And the big problem with this from the perspective of forecasting and reporting on Lack of Reserve levels, is that the key process used to do this for the on-the-day timeframe is the half hourly PDPASA run, which relies on that P30 forecast. I’m not familiar enough with the mechanics of and inputs to the P30/PDPASA forecasting process to comment on how and why the disconnect occurred and persisted as long as it did, but its consequences could have been unfortunate.
Fortunately the Actual LOR2 condition wasn’t followed by Actual LOR3, because nothing tripped in the interim. AEMO announced intentions to seek short term RERT contracts in order to reduce demand, but perhaps not surprisingly were not able to conclude any given the lack of notice period and on the last Friday afternoon before a holiday week.
And on that note, thanks for reading this far and a happy festive season to all WattClarity readers.
——————————————-
About our Guest Author
 |
Allan O’Neil has worked in Australia’s wholesale energy markets since their creation in the mid-1990’s, in trading, risk management, forecasting and analytical roles with major NEM electricity and gas retail and generation companies.
He is now an independent energy markets consultant, working with clients on projects across a spectrum of wholesale, retail, electricity and gas issues. You can view Allan’s LinkedIn profile here. Allan will be sporadically reviewing market events here on WattClarity Allan has also begun providing an on-site educational service covering how spot prices are set in the NEM, and other important aspects of the physical electricity market – further details here. |
Leave a comment