For NEM junkies like us, more recently it seems that every day presents its own complexities and nuances that (given the type of company we are) we are always seeking to understand.
(a) Earlier this year we completed saw the culmination of investment in the mammoth research project that became the Generator Report Card 2018, a review of 20 years of performance of all types of generators in the NEM. Note that we’re contemplating following this up with a Generator Statistical Digest 2019.
(b) Since that time, as we have sought to embed the insights we gained through that process into our software products, we’ve found ourselves preparing an increasing number of Case Studies of interesting events in the NEM for internal consumption. We do this for several reasons – including to test our products by asking “how clearly does our software help us understand what’s happening, and why?” question.
I’d like to share one Case Study with this broader audience today – but I would ask your understanding, as I recognise that (in trying to address two different audiences through this single article) I might end up not being as clear with either audience as I might otherwise be.
There at least two reasons why I am posting this article today:
| Audience #1 WattClarity Readers – who appreciate the insights freely shared on this information site |
Audience #2 Users of our ez2view software application – who seek to use the software to produce their own insights |
| As posted at the end of August, this year has seen a remarkable increase in the incidence of negative prices in the Queensland region. That article was followed by: 1) These four questions; and 2) Some considerations about ‘who’s responsible’ for the negative prices from guest author Allan O’Neil; and 3) Allan’s follow-up explanation of why its plausible that some generators might end up in a position where there is a commercial benefit from having to pay AEMO to generate on the spot market (i.e. because of contract cover that they find themselves with).That last article was posted on 6th September (i.e. over 5 weeks ago).Since that time, the pattern of negative prices has continued, though perhaps not as strongly.Thursday last week (10th October) was a day in which the trading price was below zero for a number of hours, as shown in this trend from NEMreview v7 (a sub-set of the functionality also in ez2view): 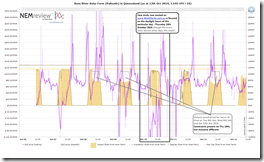 As with most images on WattClarity, click on the image for a full-screen view! As with most images on WattClarity, click on the image for a full-screen view!
As noted on the image, other days in the past week saw significant curtailment of production because of the ‘crunch’ flagged here previously. How that is unfolding is food for a follow-on article at some point later… (and unit level data would be visible in the Generator Statistical Digest 2019, should we make the choice to develop this). |
Our ez2view software (which some have described as ‘NEMwatch on steroids’) is the higher-end dashboard we provide that is used by a growing number of clients who have real financial exposure to the NEM in some way – such as by being a registered Scheduled or Semi-Scheduled Generator operating in the market.
It’s software that’s unashamedly focused on the physical market – focused on providing answers to questions like ‘why did that happen?’ Given the growing number of new entrants coming onboard (i.e. associated with Wind Farms, Solar Farms and Batteries) we’re investing an increasing proportion of our time in ensuring that the software meets the particular needs of these new entrants. Because of this, we’re focusing many (but not all) of our Case Studies on the operations of these kinds of plant. As an outcome of the rapid/iterative development principles we’re operating under, we are producing several new ‘Bleeding Edge’ versions of the ez2view software every week. That’s too frequently for our clients to stay on top of – meaning that most clients are not using the very latest versions (in fact, a number of them are still back running the ‘Stable Release’ from May 2018 – so missing out on much new functionality). In the coming months as this process continues, we might look to post some case studies here using what’s the current version of the software at the time, as one part of a process of ensuring our clients can remain aware of some of the new functionality we’re working on and so provide their input into the development path. We’re looking forward to further interactions with our ez2view clients on the materials presented below from the current ‘bleeding edge’ version of the software – focused solely on the new “Unit Dashboard Widget” that is under intensive development. Clients should remember that this is just one of 1,000s of widgets available in the software (indeed, users have the ability to create their own using the Trends Engine), so some of the inferences drawn into the material below are based on other widgets not shown in this article. |
With the above two (overlapping, but also distinctive) audiences in mind, let’s start with the substance of the case study…
(A) Animation
In this case study, we look at a 13-hour period (i.e. 06:00-19:00) spanning the daylight hours of Thursday 10th October, and look specifically at the Ross River Solar Farm (chosen as it was one that jumped out in review of the event on Friday last week, for reasons that are expanded on below). Keep in mind that the reason why we focus on this solar farm is because it helps us explore some of the aspects of market operations that we’re striving to make more clear through this particular widget (not because of any ulterior motive, so readers prone to conspiracy theories please keep that in mind).
We’ll start with the following animation that walks through all 157 dispatch intervals in the period in order to give readers an overview of how busy the day was at this particular Solar Farm:
Some of this we understand – but note that some of what happened with the solar farm puzzles us, so we’re seeking assistance from those who can help us to better understand a number of aspects of what went on (particularly trying to understand the ‘why?’ question).
(B) Questions we’d like help with, please?
If you can help us understand any of the following questions, could I ask that you contact us:
(a) You can always call us on +61 7 3368 4064;
(b) Alternatively please feel free to contact us via this feedback form;
(c) Either way, if you are planning to be at All Energy next week in Melbourne please let me know, as that might be a good place and time to meet?
We’ll look forward to hearing back from some of our readers and/or ez2view users about a number of things that are not quite as clear as we’d like them to be in the animation above. As noted in the animation:
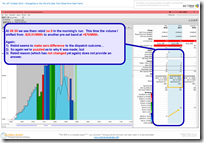
(B1) What happened with ASEFS and the apparently near Non-Conformance?
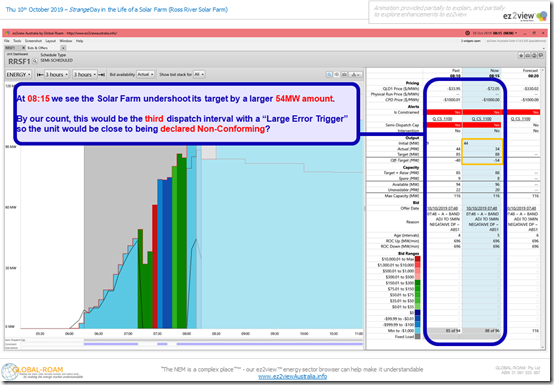
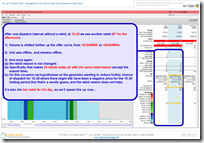
As noted through the animation there were two separate periods where it appears that Ross River Solar Farm experienced three consecutive large Aggregate Dispatch Errors that, we understand, would translate to ‘Large Trigger Errors’ (as defined by AEMO) and hence mean the imminent declaration of Non-Conforming.
(B1a) Period 1 (being 08:05, 08:10 and 08:15 dispatch intervals)
The last of these dispatch intervals was 08:15 as shown here:
In this dispatch intervals, we see that the ASEFS availability was suggesting that the plant could produce to 96MW output, and so the plant was given a target of 88MW at the time (with its volume offered down at –$1,000/MWh, which was the same as the CPD Price* at the time). However the unit actually reduced its output – from 44MW to 34MW at this point in time.
* CPD Price is ‘Connection Point Dispatch’ Price = the name we currently use to describe the constraint-adjusted price at the RRN for this DUID (so like a nodal price, except without taking into account the marginal loss factor translating a price at the RRN to at the node).
We wonder whether there was something awry with ASEFS at the time, in terms of it overestimating the capability of the plant at the time, or is there another reasons why the plant was so far under its target?
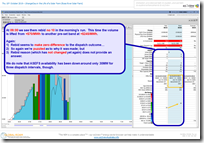
(B1b) Period 2 (08:25, 08:30 and 08:40 dispatch intervals)
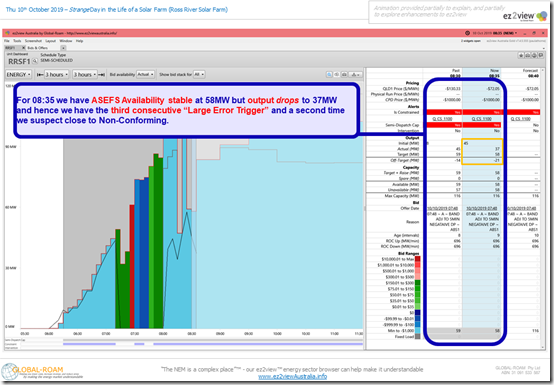
With a 5-minute break (in which the ASEFS availability forecast dropped to equal the target/actual), a similar thing happened again for another stretch of three dispatch intervals – as shown here 08:35, the third of the run:
In this case we see that the ASEFS Availability forecast had firstly jumped high but then dropped backwards again – however in all three dispatch intervals we see that the apparent Off-Target above the ‘Large Trigger Error’.
(B2) Understanding the AER’s current Rebidding Guidelines
The AER’s current Rebidding Guidelines are explained in our WattClarity Glossary here – including how we have previously used the 2017 Guidelines in categorizing rebids to 31st Dec 2018 as ‘Not Well Formed (Strict)’ as one part of the analysis for our Generator Report Card 2018 (and which we might extend further in the Generator Statistical Digest 2019, if we decide to start that)
In our animation above, we note how the rebids seen through this day for Ross River Solar Farm would also fall into the same category as ‘Not Well Formed (Strict)’ because of both:
(a) Use of the tilde as a separator (i.e. the ’~’), instead of simply just the space as requested by the AER (we discussed in the Generator Report Card how this was a common shortcoming identified in many bids, suggesting a standard feature in third party software – albeit one that’s not strictly adherent with AER guidelines); and
(b) Use of a colon to separate HH from MM in the time field.
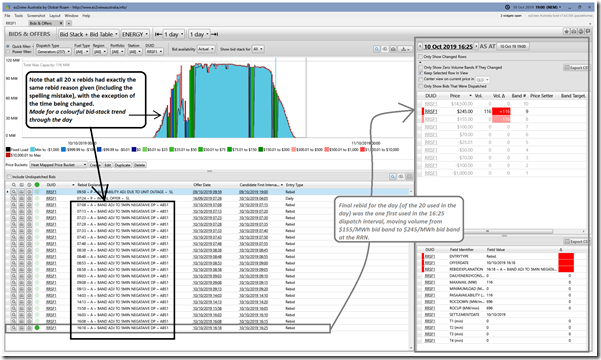
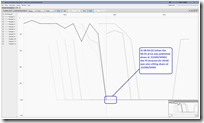
Leaving this to one side (as it is still possible to tweak an algorithm to accept a looser interpretation of the AER guidelines – hence the ‘Well Formed (Loose)’ definition) what’s of more interest is the fact that the the rebid reasons did not change for all 20 rebids through the day, as seen in a focused version of the ‘Bids and Offers’ Widget in ez2view:
As noted in the animation on several occasions when this happened, from a practical purpose it made the rebid reason not very useful for me interpreting the reasoning behind all the changes in bids across the day…
We wonder if the ‘ABS’ acronym is supposed to stand for ‘automated bidding system’ (of which there are several operating in the NEM) and wonder, more generally, how this move to automation will help with the AER’s requirement that the description “is a verifiable description of the events or occurrences that explain the rebid. “
Perhaps some of our readers can help here?
(B3) What was the intention with some of the rebidding?
Firstly we need to remember that it’s impossible to know what a participants motivations are for how they operate in the market (any market) – though it does not help other stakeholders having valid reasons for wanting to have a guess.
As such, it is essential for us to provide a means by which licensed users of ez2view can try to do this themselves with our software. Falling into the same role myself, I’ve tried (in the animation above) to piece together some possible reasoning for why each of the 20 rebids was made through the day – making particular note of whether what’s visible to me helps me come up with a plausible explanation or (in some cases) leaves me a bit mystified of what the purpose was.
I’m particularly interested in help from those who can fill in the dispatch intervals where I have marked a “NO” under the “Do we think we understand why?” question.
| First Dispatch Interval of Effect | Do we think we understand why? | Comments on the particular rebid | Do we think it was effective? |
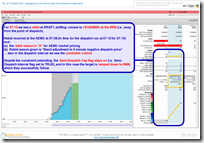
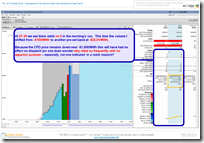
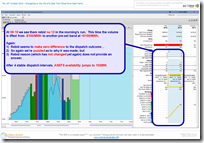
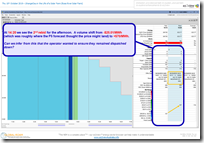
| 7:15 | YES | The 1st rebid for the day happens (we presume) because they want to avoid being dispatched at negative price. As noted in the image below, this shifts their volume up to a bid band well away from the dispatch price for that dispatch interval and hence their target is wound down to 0MW and they are offloaded:
It seems that this has met their objectives. |
YES |
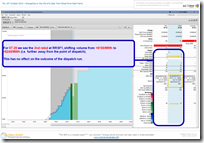
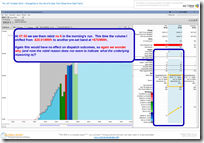
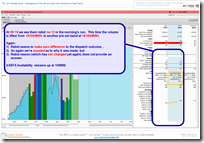
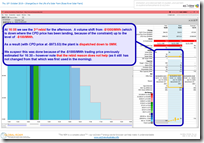
| 7:20 | NO | The 2nd rebid is the next dispatch interval, and moves volume further away from the RRP (which is down at –$1,000/MWh):
It’s not immediately clear what this was intended to achieve (and cannot be seen to have had any effect on dispatch outcomes). |
NO |
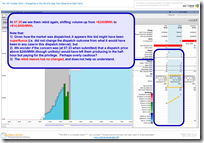
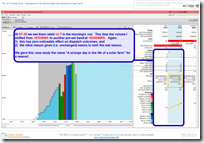
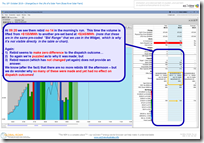
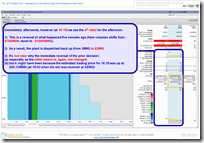
| 7:30 | NO | The 3rd rebid for the day (and one at the end of this trading period) we see the volume move further away from the regional reference price – all the way to $14,500/MWh:
Again it’s not immediately clear what this was intended to achieve (especially as it was only volume for that dispatch interval which was shifted). It certainly did not affect the dispatch outcomes. |
NO |
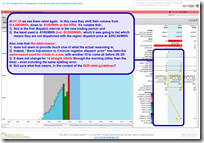
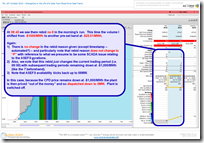
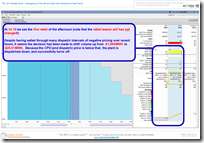
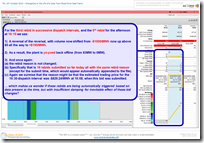
| 7:35 | YES | The 4th rebid for the day is the first in the new trading period, and needs to be seen in conjunction with what the bid band would have been if the rebid had been made – which was –$1,000/MWh and not the bid band used for the 07:30 dispatch interval:
Note however that this is only the case because of the way in which the generator had only rebid volume for the 07:30 trading period in the rebid immediately beforehand (which is an approach I’ve not seen too many other generator use): In this case, the rebid makes sense to me. |
YES |
| 7:40 | MAYBE? | The 5th rebid for the day (immediately after) we see the volume shifted up closer to $0/MWh (to –$25.01/MWh):
In the animation we wonder about the logic behind this move, but perhaps the generator was concerned the price might move up closer to their –$100/MWh bid band (hence requiring dispatch at negative price). Why the move only to –$25.01/MWh if this was the case is not clear to us… We do certainly know that it had no effect on the dispatch outcome. |
NO |
| 7:50 | NO | Skipping 07:45 we move to 07:50 and the 6th rebid for the day:
As noted in the animation, it’s not clear why this was done – and it’s certainly clear that it had no effect. |
NO |
| 7:55 | NO | Next dispatch interval we have the 7th rebid for the day:
As noted in the animation, it’s not clear why this was done – and it’s certainly clear that it had no effect. |
NO |
| 8:45 | YES
… or MAYBE? |
The 8th rebid for the day happens 50 minutes later, and (it seems) clearly in response to the dispatch price plunging to –$290.25/MWh in the 08:40 dispatch interval:
As a result, the generator shifts volume away from –$1,000/MWh to be dispatched down. We do have a question, though – why not rebid to a high positive price at this time? |
YES |
| 8:55 | NO
… or MAYBE?
|
After a rest of 1 dispatch interval, the 9th rebid for the day comes for the 08:55 dispatch interval:
In this case volume is shifted higher (maybe on concern that the price would rise above –$196.16, with a rise of 66c/MWh shown in P5 predispatch) – but perhaps this only needs to happen as the same approach was not taken in the rebid for 08:45? In any event, because of the what happens external to RRSF1 the change in bids has no effect. |
NO |
| 09:00 | NO
… or MAYBE?
|
Immediately after (for the last Dispatch Interval in the 09:00 trading period) the 10th rebid for the day occurs:
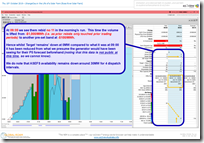
This is shifting volume further away from the point of dispatch – but note that (as also seen in ‘Forecast Convergence’ widget) the forecast dispatch price for 09:00 at 08:53 (when this rebid was submitted) was down at –$1000.00 so one does question the need to shift capacity higher still: |
NO |
| 09:05 | YES | At this point, we’re only half-way through the rebids for the day.
The 11th rebid for the day saw volume actually shift from the –$1,000/MWh (where it would have been in this new trading period had the rebid not been made) to be –$100/MWh: This results in the plant avoiding dispatch with the dispatch price down at –$980.54, which we presume is what they wanted. However it is worth noting that this additional rebid was only necessary because the prior rebid only moved volume for 09:00 (again, an approach we have not seen as common). |
YES |
| 09:10 | NO
… or MAYBE?
|
The 12th rebid for the day sees volume moved further higher, away from the point of dispatch:
Perhaps the generator was concerned the dispatch price would rise above –$100/MWh and they would be forced to dispatch, though note: |
NO |
| 09:15 | NO
… or MAYBE?
|
The 13th rebid for the day saw volume moved from +$100/MWh up to +$155/MWh:
Despite it not having any effect (in hindsight), perhaps it could be understood as a result of nervousness on the part of the generator (same as in the rebid in the dispatch interval) |
NO |
| 09:20 | NO
… or MAYBE?
|
Immediately afterwards we see 14th rebid for the day (and last for the morning):
As per the immediately preceding 2 rebids: |
NO |
| 14:10 | YES
… but it seems sub-optimal?
|
The 15th rebid for the day (and first for the afternoon) occurs some hours after the morning bunch.
It’s important to note that in the immediately preceding trading period the trading price had ended up down at –$225.43/MWh as a result of 4 x negative prices (particularly 13:55 and 14:00), and yet there was no rebid in those periods and the generator sailed right through. We’re curious? Leaving aside that seeming inconsistency, and the fact that a negative price was forecast for the 14:05 dispatch interval prior to the start of the trading period, it is understandable that a rebid was made at 14:03 to shift volume for the 14:10 dispatch interval to a higher-priced bid band as shown here… |
YES |
| 14:20 | YES
… but it seems sub-optimal?
|
The 16th rebid for the day happens 2 dispatch intervals later:
Volume was shifted out of the -$25.01/MWh (we think in response to a forecast price just below it at –$26.07) up to +$70/MWh. In this case, the dispatch price for 14:20 lands at –$23.77 so it seems that (without the rebid) RRSF1 would have been dispatched. Hence a successful rebid – though we wonder why this was not just done at 14:10? |
YES |
| 16:05 | YES | For the 16:00 trading period (i.e. including 15:58, the point where the 17th rebid for the day is made) we see that the forecast dispatch price for all 6 intervals in the next trading period is down at –$1,000/MWh. Hence we can understand why RRSF1 shifts volume here:
As it happens: |
YES |
| 16:10 | YES, we think | The 18th rebid for the day sees a reversal of the prior rebid – which, as noted in the image, might have been because the forecasted half-hour price was for it to be up at +$25.13/MWh:
There were no other rebids from other QLD generators for 16:10 and yet the rebid from RRSF1 dropped the dispatch price down to –$999.99/MWh. Ouch! This is just one more illustration of how “Risk” is an increasing feature of the NEM these days, as explored in Theme 2 within Part 2 of our Generator Report Card. |
YES it was effective (in that it changed the price)… but
NO, we don’t think the generator would have liked the outcome. |
| 16:15 | YES | Perfectly understandable, then, that the 19th rebid for the day followed immediately afterwards – with the shift of volume up to +$155/MWh:
We do wonder, however, why many of the earlier rebids did not move volume like this (i.e. up many bid bands)? Note in this instance that a number of other portfolios also rebid in response to the price drop (including some ‘Not Well Formed’ even with a Loose definition). They are food for other Case Studies… |
YES |
| 16:25 | NO
… or MAYBE?
|
A gap of 1 dispatch interval afterwards, we see the 20th (and final!) rebid for the day:
Despite it not having any effect (in hindsight), perhaps it could be understood as a result of nervousness on the part of the generator (same as in the rebid in the dispatch interval) |
NO |
Wow! That was a busy day for this particular generator (and a number of others as well) …
(C) Who do you know who can help us?
Hopefully the case study above gives you some idea of the one of the activities we’re investing heavily in, aligned with our Reason-for-Being of “making the market more understandable, so our clients can make better decisions”? Our prime focus needs to be the growing number of clients using ez2view (and/or our other software products) – but we’re also happy to share some insights like this Case Study to the readers of WattClarity.
As noted at the top, there never seems to be an end to the ways in which we can continue to improve, and we wonder if you know of people who would easily slot into our team to help us do either or both of the following:
| Market Analysts … who can help us understand more |
Software Engineers … who can help us build faster |
| We’re keen to hear from those who can help us understand what we have missed, or misunderstood, in the Case Study above.
That’s not the only role these ‘Market Analysts’ would play for us, and we have happy to discuss further (one-on-one) with interested parties. |
Our ‘things to do’ listing (more formally called a ‘Backlog’) contains enough already to keep us going out till around 2030 or thereabouts – no joke.
That list keeps growing in a variety of ways (e.g. we’ve added a number of additional insights, already, in the process of putting this Case Study together). It’s a nice position to be in – and we are grateful of our client’s appreciation of us in that: We’d like to be developing more quickly, if we could find a way to utilise additional resources who could hit the ground running with us (given what we’re doing, we don’t have a lot of time to focus on recruitment and elaborate onboarding currently). Hence it would take a pretty particular person to be able to slot in and contribute well at the present point in time. |
We’re keen to talk with those who can help us in either (or both!) of these ways – and don’t have pre-set ideas for how these arrangements might work. Hence please do point them in our direction:
(C1) Call us on +61 7 3368 4064; or
(C2) Provide details for us on this feedback form.


Fascinating article and great explanation of a complicated process. Apologies. I am little confused about the undershoot references (i.e. “so far under its target?”) above and possible “large-error trigger” non-conformance. In a previous article .. https://wattclarity.com.au/articles/2018/09/a-case-study-in-active-management-at-a-semi-scheduled-plant-tuesday-24th-july-2018-at-lake-bonney-2-wind-farm/ it was indicated that ‘For the Semi-Scheduled plant, the Target effectively acts as a Cap – i.e. AEMO is telling them to “don’t produce any more than Target MW” at the end of that dispatch interval.’ I suspect I am missing something about the semi-schedule dispatch process, particularly when the semi-dispatch cap is set. Any chance of a clarification would be appreciated. Thanks .. Geoff