Back on 14th October, we published this Case Study of Ross River Solar Farm operations through Thursday 10th October 2019.
We received a number of points of feedback from readers about this, including from a number of new entrants – with these readers thanking us for helping to make some aspects of Semi-Scheduled plant operation more visible and understandable. Thanks for the feedback!
For similar reasons, we’re adding this second Case Study today – but focused on a different generator this time. It just so happens that this case study:
(a) also focuses on a Semi-Scheduled Solar Farm;
(b) where the asset is also operating in northern Queensland (so is suffering from ”the crunch” noted back a year ago now).
Other case studies will follow in due course – not all of them focused on solar, and not all of them focused on northern Queensland.
If you know of other interesting events in the NEM you’d like us to illustrate using a similar mechanism, please do let us know (details at the bottom of the article)? Note that (because of where we are focused with the software at present) we’re particularly interested in looking at operations at a particular DUID, rather than a broader collection at this point.
(A) Recapping why we’re posting Case Studies
As with the first Case Study (RRSF1) we are posting this Second Case Study knowing that (in trying to address two different audiences through this single article) I might end up not being as clear with either audience as I might otherwise be. These are the two primary reasons why we’re creating, and then posting, these Case Studies:
| Audience #1 Users of our ez2view software application – who seek to use the software to produce their own insights | Audience #2 WattClarity Readers – who appreciate the insights freely shared on this information site |
| Our prime focus is* our growing group of licensees to our ez2view software (the higher-end dashboard we provide to a growing number of Scheduled or Semi-Scheduled Generators operating in the market – amongst others).
* when I say “is” what I really mean is “must be” as these clients are the means by which we have the wherewithal to share some insights more broadly on WattClarity. It’s software that’s unashamedly focused on the physical market – focused on providing answers to questions like ‘why did that happen?’ We’ve invested $MIllions in R&D for ez2view in prior years, and investment path that will continue into the future as the level of complexity facing wholesale market participants continues to grow. As an outcome of the rapid/iterative development principles we’re operating under, we are producing several new ‘Bleeding Edge’ versions of the ez2view software every week. Part of this rapid development process is that we observe, tag, and then later analyse “interesting” events in the NEM through process such as Case Studies like these. These Case Studies help us to explore the degree to which our software (and specifically in this Case Study, one particular Widget amongst the 1,000s available – the “Unit Dashboard Widget” – helps to make levels of complexity clearer, and understandable.
|
As the energy transition continues to progress, we see a growing number of new entrants begin operations as generators in the NEM, or (further upstream) investigate possibilities to develop their own generation.
A number of these new entrants are coming onboard as clients (e.g. to use our ez2view software when operational, or more generally with our Generator Report Card 2018 and other products, and we’re intrigued by the prospects of other new ventures we’re involved with). However that is only a subset of the rapidly expanding number of organisations and individuals who are taking an increasingly close look at the National Electricity Market – with a broader group of people subscribing for update from WattClarity on days where new articles are published here. Given that we’re investing considerable effort (including input from some on our Customer Advisory Board) to create these case studies as a way of exploring specific nuances in the NEM we want our software to provide clarity about (which will flow through to benefit our growing group of software licensees), we reasoned that we may as well publish some (but not all!) of these, in order to provide value to the WattClarity readership (a broader group of stakeholders). There can be an added benefit to us in publishing these Case Studies – hence we ask our readers to help us understand the extent to which this event (and the broader implications of events like this) are clearer as a result of the Case Study?
|
With the above two (overlapping, but also distinctive) audiences in mind, let’s start with the substance of the case study… (please do let us know what we have missed, or misunderstood, anything in the comments below or in the animation?)
(B) Animation of DAYDSF1 on 3rd September 2019
The event we choose to look at today occurred 8 weeks ago today – back on Tuesday 3rd September in the Queensland region of the NEM, and specifically with respect to the Daydream Solar Farm.
We noticed the event at the time but it’s taken some weeks for us to be able to publish this case study for a couple of reasons, including:
(i) the general busyness we’re blessed with at present (you might be able to help us with that – see at the bottom of this article), and also
(ii) because we wanted to use this event to drive enhancements to the software such that it could be explained through a single widget in the software rather than multiple widgets.
With the release of ez2view v7.4.5.591 on Monday 28th October we’re not yet finished with what we want to do, but are in a position to drop images into the following animation to share with you, and gain your input (thanks for input already from some – animation slightly updated):
This animation takes about 10 minutes to replay, and we did not have time to add audio.
Please accept our apologies that we don’t have time to comprehensively explain all the different elements of this widget in the animation here. There is tool-tip functionality built into the software for clients, and (as with all the other widgets in ez2view) there is (or will be, in this case, when we have settled on a final design) detailed online help to assist (under the “?” icon on the widget).
(C) Insights (and Questions) shared here today
You might not have time, right now, to sit through the 10-minute animation above. For this reason, we’ve extracted a number of the key insights and questions we’ve noted through the animation – and would welcome your thoughts and feedback on any or all of these (either in public comments below, or one-on-one via the contact details at the bottom of the page)?
(C1) Challenges with ASEFS early in the day
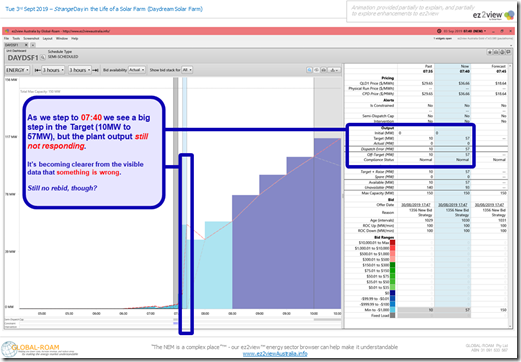
At 07:40 on the morning we saw that the dispatch target provided to the plant by AEMO increased from 10MW (target for dispatch interval ending 07:35) to 57MW (target for 07:40).
This target was derived by NEMDE because ASEFS had calculated that an output of 57MW was possible (i.e. local irradiance suggested that yield for the number of inverters in service)
This meant a “Dispatch Error” calculated as +57MW (i.e. Target – Actual), which also equated to an “Off-Target” figure (with “Off-Target” being the same as “Dispatch Error” here because the unit is not enabled for Regulation FCAS). These numbers are important, because NEMDE is the algorithm used to balance supply and demand, so if a Dispatch Error of +57MW from any unit needs to be compensated for by supply elsewhere. :
(i) In real time on the day, the absence of 57MW could mean other units in the Raise FCAS markets being called on to keep the frequency at 50Hz (all else being equal)
(ii) Were such a phenomenon to be an ongoing occurrence, I would understand if it flowed into the requirements for increased FCAS enablement levels (hence increased market cost), for example.
———————————————————————
In our Generator Report Card 2018, we took a look at a metric we called “Off Target” in the report (used a slightly different calculation) to perform a range of different analysis – including looking at the extent which large unexpected changes across the coal fleet had been a surprise to the AEMO, as one indicator of “Sudden Failure”.
In ez2view now, with this version, we’ve implemented both “Dispatch Error” and “Off Target” as metrics derived dynamically from the data sets published for a (user-selected) DUID in a Dispatch Interval. There’s still a bit more we need to do to make “Off-Target” – and hence Compliance Status – correctly account for all instances of enablement of Regulation FCAS.
Given that the end of the year is rapidly advancing, we’re contemplating the publication of a Generator Statistical Digest 2019 in January 2020 as a partial-update to the Generator Report Card 2018. If we did this (and that’s still an if!), we would be keen to explore the performance of “Dispatch Error”, “Off-Target”, and “Compliance Status” across all DUIDs right across Calendar 2019. Contact us if you are interested…
———————————————————————
As noted in the animation, the positive Dispatch Error at +57MW was as large as the dispatch error reached through this day – but is something we would like to understand more about, more holistically.
(C2) Constraint-induced CPD Price Divergence
With the recent release by AEMC about documentation surrounding COGATI (yet another acronym to bury new entrants in) there has been talk about how some of the changes being contemplated would move the NEM from a regionally-priced market to one working with nodal prices.
It’s important to understand that the NEM is already dispatched using nodal prices, it’s just that they are not very visible to wholesale market participants (and stakeholders more broadly). With the latest enhancements we have been working on in ez2view, we’re providing more easy visibility of translated nodal prices in the form of a “Connection Point Dispatch Price” (i.e. CPD Price – our own acronym, sorry to add to the load).
———————————————————————
Amongst other things, what COGATI might do is take the NEM’s starting point with nodally-priced dispatch and take a few steps further, with:
(i) Use of dynamically calculated locational loss factors (rather than the forward-looking, annually-based Marginal Loss Factors currently used, or the forward-looking, annually based Average Loss Factors under consideration); and
(ii) Extend the dynamic nodal prices through to settlements (rather than the current process which uses the regional reference price for settlements.
(iii) Establishing some way to ensure there is the ability to hedge between disparate nodes (one of the challenges inherent in moving to nodal prices that has been known about since as far back as 1997).
… but all of that is food for a separate article at some point.
———————————————————————
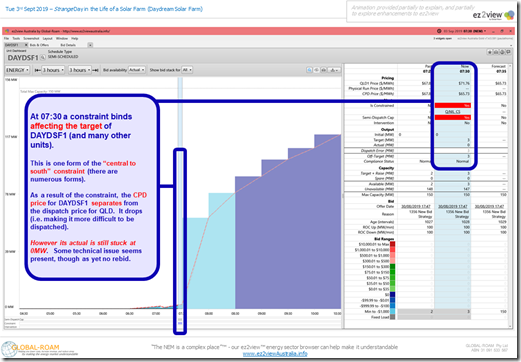
At 07:30 on the day, one form of the Central-South constraint binds, favouring generation south of the “central-south” transfer in QLD, compared to generation in the north. On this occasion (i.e. relatively early in the morning, with solar farms in northern QLD collectively contributing only a small amount) the divergence between the regional dispatch price (at $71.76/MWh) and the CPD price specific for DAYDSF1 (here at $65.73/MWh) was not huge:
In this particular case, as well, it made no difference to the dispatch outcome, as the plant was (at that time) unable to produce any output despite having a dispatch target of 3MW.
———————————————————————
In November 2018 we noted about a crunch escalating for northern Queensland, with the rapid influx of new generation projects being constructed for operations in the northern half of Queensland (i.e. north of this central-to-south bottleneck). In one-on-one conversations since that time, it’s become clear that some of that message was lost in translation, as (it seems) it’s not just the central-to-south link that will be congested in future.
It seems probable that there will also be congestion occurring between the northern and central areas of Queensland as well (in essence between the areas of Mackay and the area of Rockhampton) due to the volume of generation development in the north, the relatively small size of demand in the area, and the network capability. If/when this happens, we’ll see the outcome of this with CPD prices for projects like DAYDSF1 (and many others) down at –$1,000/MWh for increasing number of hours in the day, even if the regional price is well above $0/MWh.
This will mean (even moreso) the days of ‘set and forget’ bidding for Semi-Scheduled solar and wind will be well and truly in the past.
———————————————————————
However the ‘crunch in northern Queensland’ is also food for a separate follow-on article at another point.
(C3) Non-Conformance
The MMS table “Dispatch Unit Conformance” table is private to individual participants for all time, meaning that it’s not possible for any participant (or other stakeholder) to see the explicit Compliance status of any other unit at any given Dispatch Interval. Some data is published (e.g. Market Notices – somewhat delayed, and Private Constraints – day after).
Not to be dissuaded by this, in the version of ez2view used in this animation we have built our own reverse-engineering of the logic for the AEMO’s Operating Procedures which now works for all units in a historical context, including (we believe) correctly taking into account FCAS Regulation Enablement levels). We are very keen for the clients we have with access to private data for their own units to double-check the logic in order that it works correctly in all of these cases?
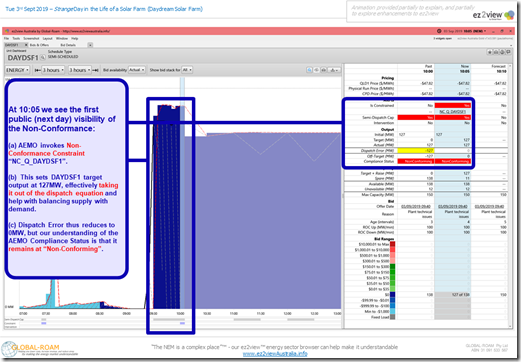
I’ve lifted out the snapshot for 10:05 here which is the first dispatch interval in place where the Non-Conformance constraint was bound for DAYDSF1. As noted in the animation, there were 13 dispatch intervals (through till 11:05) where the constraint was bound:
However the story did not start at 10:05 but back at 09:25 where we saw a negative Dispatch Error of –23MW where the unit suddenly ramped up (from 0MW to 23MW) despite not having any availability deemed in ASEFS (and hence no dispatch target). We see:
(i) 09:25 and 09:30 a similar story (with Dispatch Error up at a large –127MW at 09:30)
(ii) 09:35 and 09:45, by our automated logic, AEMO declaring the unit “Off-Target” as a result of not following dispatch targets which were imposed then)
(iii) Status upgraded to “Not Responding” for 09:45 and 09:50; then
(iv) Upgraded further to “NC Pending” for 09:55; before
(v) We calculate being declared “Non Conformance” for 10:00 (which would be 5 minutes before the constraint was bound).
———————————————————————
Worth re-iterating that we’re contemplating a longitudinal exploration of the incidence of these measures in a (possible) Generator Statistical Digest 2019 for publication in January 2020.
———————————————————————
We’d very much like to understand if we have the logic correct, so are keen to hear from those who can help us – please get in touch at the contact details below?
(C4) Bids being “Not Well Formed”
Through the period of the animation there were 4 different bid structures* shown that were used at different points in the period of the Case Study.
* note also that there were actually 5 different bid structures in play for the day, but one of them (unfortunately) did not even see a dispatch interval, for reasons explained in (C5) below.
Worth re-iterating that none of these bids would satisfy our automated logic for being “Well Formed (Tight)”, which we have coded based on our interpretation of the AER’s Rebidding Guidelines.
———————————————————————
We’ve pieced this page together in a Glossary section of the WattClarity website to explain our understanding of Rebidding (and will endeavour to keep it updated as our understanding evolves – and as the AER’s procedures change, such as with 5 Minute Settlement.
As noted on that page, we investigated “Bids Well Formed” as one of the many different metrics analysed for our Generator Report Card 2018, and are keen to explore this further (at a discrete unit level) for our (possible) follow-on Generator Statistical Digest 2019 for publication in January 2020.
———————————————————————
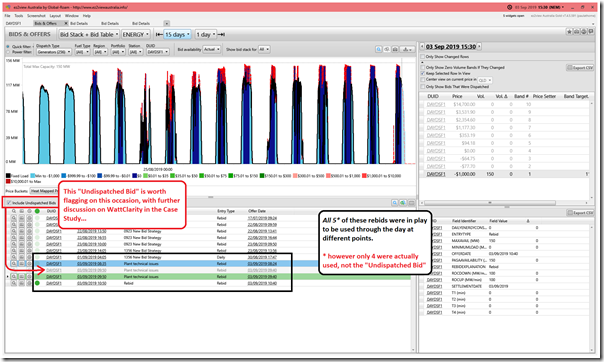
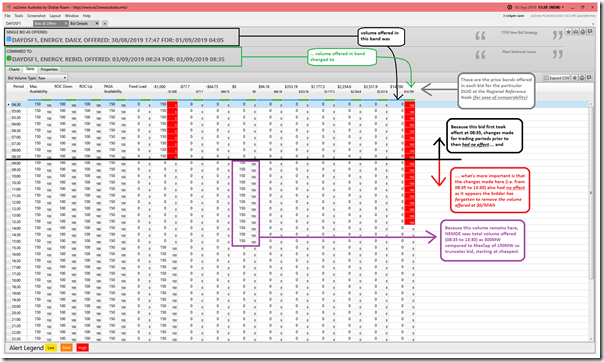
I’ve loaded in here a snapshot from a different widget in ez2view (i.e. the current version of the “Bids & Offers” widget), which lists each of the 5 bids in play for the day – only 4 of which were used:
Note that all 4 of the rebids made on the day (3 of which were used):
(i) Omitted the HHMM code to alert stakeholders (the AEMO, the AER, Market Participants and others like us) to the time at which the event occurred that triggered the need for the rebid
(ii) Omitted the Category used to classify the rebid; and
(iii) In the case of the last one, which just included a reason “Rebid”, does not appear to provide a brief, verifiable, contemporaneous record of the reason for the rebid.
(C4) Plant technical issues
As can be seen in the image above the operator at DAYDSF1 indicated that there were “plant technical issues” that were the reason* the rebids – and presumably were also the reason for the plant being Off-Target (and hence suffering declared Non-Conformance.
———————————————————————
* Readers should note that I am not suggesting that the participant needs to reveal more details in the Rebid Reason about what the specific technical issues were that were encountered at the time – though there should be a contemporaneous record which many participants store in an offline Bid Log (hence the “SL” – i.e. ‘See Log’) resource at the time.
———————————————————————
We would like to understand more about the nature of the technical issues that might arise at solar farms (or, indeed, any plant) that would lead to plant being unable to follow its dispatch targets. Understanding more about this might help us drive our software further, to help our clients understand more of the picture of what might be going on at times like this.
If you can help us – or know of people who can – please get in touch (details below).
(C5) Bid changes that have no effect
In the bid table shown above there were 3 real changes in bid made through the day – none of which actually ended up having any effect on the NEMDE dispatch process for a few different reasons.
It’s worth drilling into each of these, in turn, in order to help those new entrants amongst the readership keep in mind for their future operations. In order to do this, I have used the “Compare Bids” function within ez2view, which enables the user to compare specific changes made between two (user-selected) bids:
1st change in bid (from 08:30 to 08:35)
At 08:24:23 the AEMO received a rebid from the participant that had “Plant technical issues” as the rebid reason. Because it did not contain a HHMM code in the reason we are not able to determine when the technical issues occurred, but we can guess that it had something to do with the fact that the plant was having difficulties starting (remember, above, that it was receiving dispatch targets because ASEFS said it should have output capability, but could not produce anything).
As a result it is logical to think that the plant might have been bid out of the market (i.e. capacity removed up to the Market Price Cap) whilst the operator would have been trying to resolve the technical issues. Unfortunately it appears that, in the process of trying to do this, a mistake was made in the bid submission process leaving volume at $0/MWh, and hence the dispatch targets continued to ramp up in subsequent dispatch intervals.
2nd change in bid (from 09:45 to 09:50 – a ‘double banger’)
This is the one where there was an un-dispatched bid that seemed to indicate another mistake.
The 1st rebid above was used by AEMO in the NEMDE dispatch process for 15 sequential dispatch intervals. Presumably during this time, the generation operator was dealing with a few different things at once, including:
a) Trying to rectify whatever the technical issues were at the time, which essentially amounted to two periods:
(i) From 08:35 to 08:55 they were receiving non-zero dispatch targets, but seemingly unable to actually ramp up; but then
(ii) From 09:25 to 09:45 they were ramping up quickly but a dispatch target stuck at 0MW (because of availability stuck at 0MW) – hence the Non-Conformance above.
b) In parallel, we guess (remembering that it is impossible to know) that there was a bit of head-scratching going on as they tried to work out why they were still getting non-zero dispatch targets, if the intent of the 1st rebid was to price capacity out of the market whilst they sorted out operations.
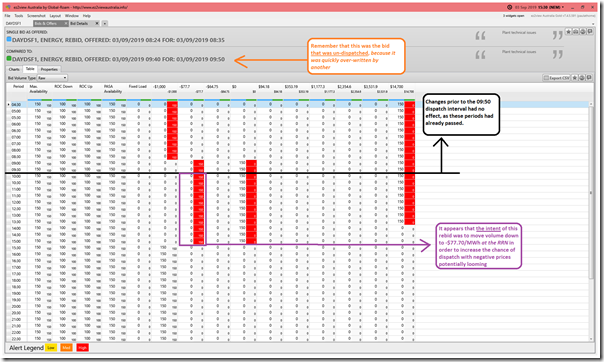
As a result of this we see two bids offered submitted 2 seconds apart as follows:
2019-09-03 09:40:22 = volume moved negative
As noted on the screenshot, in this particular case it appears as if the intent was to provide more opportunity to dispatch the plant if the CPD price were to drop below $0/MW (down to –$77.70/MWh) because of the way the bids were changed….
… however this bid did not ‘stick’…
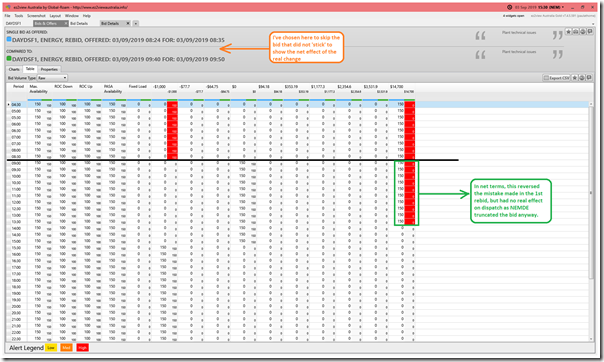
2019-09-03 09:40:24 = volume removed
Two seconds later, we see a second bid received at the AEMO – which superseded the prior one (which, as a result, never saw any action as part of the dispatch process). As a result, the net change in bid seen by NEMDE looks as follows:
As noted here, the net effect of overwriting the rebid 2 seconds earlier was just to reverse the error made an hour prior in the first rebid – but this would have had no real effect on dispatch, as the NEMDE algorithm truncated the 300MW volume offered down to the 150MW maximum capacity of the unit.
Was this a result of some sort of ‘fat finger’ mouse-click error on submission to AEMO?
3rd change in bid (from 10:45 to 10:50)
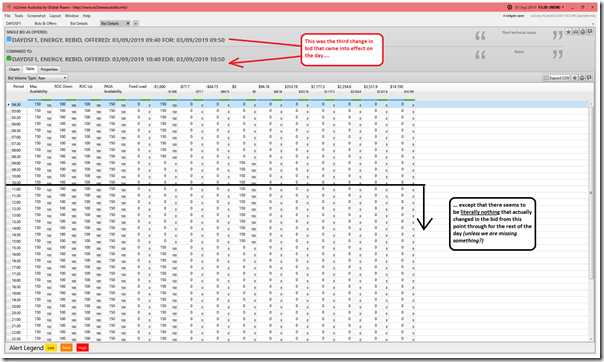
An hour later, we see the third rebid affected on the day:
… except that (unless we are missing something – in which case, please let us know?) it beats me what the purpose of this rebid was, as literally nothing appears to have changed in the rebid – other than (as discussed above) the Reason being changed to the entirely unhelpful text entry ‘Rebid’!
With each of the changes above, it is important to understand that (despite the fact that were still operating under 30-Minute Settlement for another 20 months) bids in the Energy & FCAS Markets already effectively operate on a dispatch interval (i.e. 5-minute) basis. Helpfully, our ez2view software has been representing bids on a dispatch interval basis for many years, making it much easier for clients to understand what’s actually happened.
Might be worth checking that the tools you are using also do the same?
(D) Can you help us?
As we noted with this Case Study published on 14th October (thanks to those who responded there!), we’re hoping that you might be able to put us in contact with others who can help us in either (or both) of the following ways.
| Market Analysts … who can help us understand more |
Software Engineers … who can help us build faster |
| We’re keen to hear from those who can help us understand what we have missed, or misunderstood, in the Case Study above.
That’s not the only role these ‘Market Analysts’ would play for us, and we have happy to discuss further (one-on-one) with interested parties.
|
Our ‘things to do’ listing (more formally called a ‘Backlog’) contains enough already to keep us going out till around 2030 or thereabouts – no joke.
That list keeps growing in a variety of ways (e.g. we’ve added a number of additional insights, already, in the process of putting this Case Study together). It’s a nice position to be in – and we are grateful of our client’s appreciation of us in that: (b) There’s no shortage of helpful suggestions coming in from this expanding client base (some new, some 10+ years into a relationship). We’d like to be developing more quickly, if we could find a way to utilise additional resources who could hit the ground running with us (given what we’re doing, we don’t have a lot of time to focus on recruitment and elaborate onboarding currently). Hence it would take a pretty particular person to be able to slot in and contribute well at the present point in time. |
Hopefully this second case study above gives you some idea of the one of the activities we’re investing heavily in, aligned with our Reason-for-Being of “making the market more understandable, so our clients can make better decisions”?
Our prime focus needs to be the growing number of clients using ez2view (and/or our other software products) – but we’re also happy to share some insights like this Case Study to the readers of WattClarity. As noted at the top, there never seems to be an end to the ways in which we can continue to improve, and we wonder if you know of people who would easily slot into our team to help us do either or both of the following:
We’re keen to talk with those who can help us in either (or both!) of these ways – and don’t have pre-set ideas for how these arrangements might work. Hence please do point them in our direction:
(C1) Call us on +61 7 3368 4064; or
(C2) Provide details for us on this feedback form.


Leave a comment