On Friday last week I posted this article noting how the year-to-date total of number of dispatch intervals at or below $0/MWh in the Queensland region of the NEM was already more than double any prior year (and that was not even at the end of August).
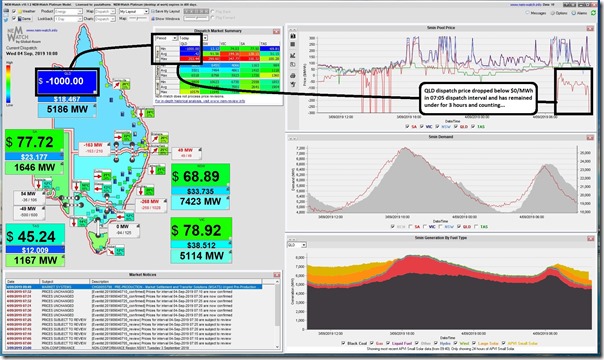
Well, that pattern has just continued through the weekend and into the current week, the first week in spring (where incidentally we see a forecast temperature peak at 33 degrees in Brisbane today, which seems a little bizarre). I snapped this screenshot from NEMwatch v10 dashboard in the 10:00 dispatch interval showing the second instance this morning where the dispatch price has dropped down to –$1,000/MWh in the Queensland region:
As shown on the image, the first price drop occurred at 07:05 this morning, which was the first period in what’s historically been called the “peak” pricing period (we might want to speed up our thinking about the structure of “peak” and “off-peak” hedges, like Dave Guiver spoke about before).
As discussed in our Generator Report Card (not just in Theme 2, but also elsewhere through the 170-page analysis) the level of risk in the NEM is escalating, and what’s happening with these negative prices is one small part of this.
On WattClarity here we will be further examining different aspects of these risks, as time permits – but this is meant as a supplement to the fuller consideration provided in the Generator Report Card.
All I have time for today is to pose four questions:
Q1) Which new entrants have been ‘swimming naked’?
I’ve read in several places before at quote that’s been attributed to Warren Buffet – something along the lines of:
“You only learn who’s been swimming naked when the tide goes out”
Now my understanding is that Warren was speaking about investors in the broader market – however the general sentiment behind that quote could be also equally attributable to generators in the National Electricity Market.
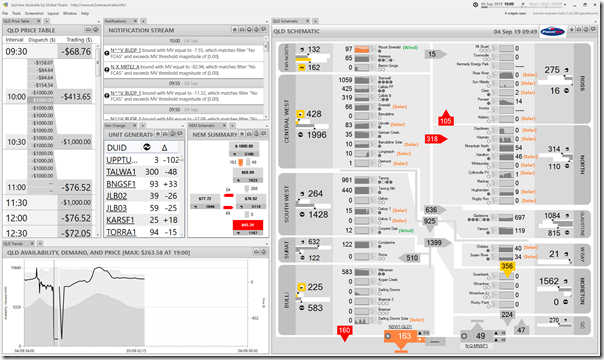
After firstly reminding readers (and myself!) that it’s impossible to actually know a participant’s motivation, though it does not stop us guessing, I thought it would be useful to use this snapshot from our ez2view higher-end software package showing the power stations operating in the QLD region up until the 10:00 dispatch interval this morning:
Note that the drop in dispatch price to –$1,000/MWh was the second in the trading period, meaning a Trading Price for the half-hour down at –$413.65/MWh for the half-hour ending 10:00 (i.e. generators paying $413.65/MWh to stay online). Even allowing for revenue earnt from LGCs generated in this half-hour, this would seem to indicate no-one comes out of this half-hour whole.
I’ve helped those unfamiliar with the “QLD Region” Schematic within ez2view by annotating the plant that are either Wind (only 2 currently, with more on the way) or Large Solar (loads, with many more coming as well!). These essentially fit into two groups:
1a) Seem impervious (or oblivious?) to negative prices
There’s a group of Wind and Solar Farms we can see in the Schematic above that can be seen to run straight through the period of negative pricing this morning:
(i) Perhaps their contract structure is such that it’s someone else’s* cost (and risk) when prices are negative – so are happy to sail through with their own revenue covered by some form of PPA independent of spot pricing.
(ii) Perhaps they should be aware and responding – but are oblivious, or do not know what to do (we understand that there a number of ultimate asset owners for Wind and Solar plant across the NEM that have become quite irate at what they see as poor service provided by their current Asset Managers, so expect to see some churn on that front in the near term).
(*) Readers need to understand that their is no such thing as a free lunch – the task is moreso to try to understand where the ultimate cost (and risk) of paying to generate ultimately resides…
1b) Those that seem to have responded to negative prices by backing out
There’s another group of assets that can be seen to turn off in order to avoid negative prices. For these assets, it would seem to suggest that both:
(i) They have some incentive to avoid sustained runs of negative prices; and
(ii) They have developed the means to watch the market and respond.
Note that there is a “correct” way to turn off (i.e. through the bidding and dispatch process, via the Semi-Dispatch Cap) and there are also other ways to switch off that don’t seem to follow the intent of “bidding in good faith” (discussed previously).
We don’t have time to delve into the details of each particular asset at this point – however note that in our Generator Report Card we did invest considerable time to assess where every wind and solar plant offered all of its volume at the point of dispatch through calendar 2018 in order to try to infer how it might be contracted – and even, perhaps, what benefit they might be ascribing to LGCs. See the Wind and Solar fuel types in Part 4, for those who already have downloaded their copy.
—————————
Readers should note that there are other reasons why units might be offline – for instance it’s our understanding that Oakey 2 Solar Farm is still recovering from the major damage unleashed by the storm that uprooted most of the station many months ago now (still no official news I have seen about the recovery?). Hence readers should use caution when interpreting the data presented in the schematic.
Q2) But exports from QLD are constrained flowing south…
Now it is useful to point out that exports from Queensland to NSW are constrained flowing south because of a transmission outage between Armidale and Tamworth.
(a) This is current scheduled to last all day today (working day), and also tomorrow
(b) For those with their own access to ez2view, you can see this in constraint set “F-N-ARTW_86”.
Here’s a snapshot from NEMwatch v10 a full 90 minutes later (at 11:30 dispatch interval) showing QNI flow south still constrained and some massive price differentials (i.e. QLD price very low) continuing fairly continuously since the 09:55 dispatch interval that saw the first dispatch price down at –$1,000/MWh:
However even if participants did not know this was going on, one still has to wonder why they don’t respond when prices drop far below any revenue they might earn back on their LGCs?
Q3) What’s going on at the QLD coal plant?
It’s also logical for people to wonder what’s going on at the coal plant – as discussed in the Generator Report Card, there has been an increase in capacity offered at and below $0/MWh at the remaining coal units across the NEM (excerpt included here).
Interesting to see that the volumes offered are at far greater levels than just at technical minimum loads – which might be inadvertently giving those not so familiar with an incorrect view of (over-exaggerated) “inflexibility” of coal units.
When he finds a bit more time, guest author Allan O’Neil might unpick this one a bit more for our readers…
| Editor’s Note The following day (Thursday 5th September 2019) guest author Allan O’Neil had published this analysis here, to remind everyone that it’s not just “new solar flooding the market” that has driven prices below the floor. |
However in general terms, readers should understand that the trading teams at both Stanwell and CS Energy understand a fair bit more about the market than new entrants probably do.
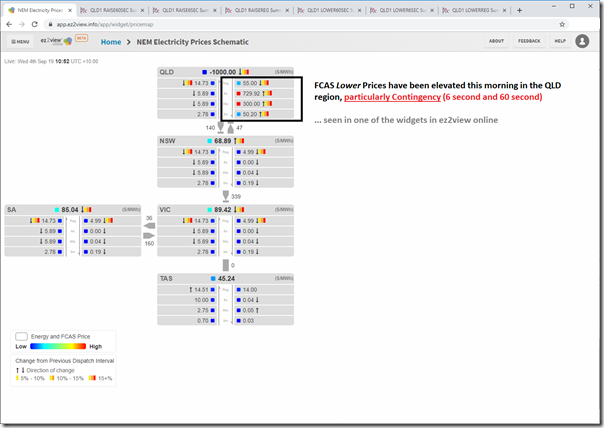
One clue to understanding what might be a reason for the way they are bidding might be to look at the broader market across all 9 commodities, to also see that FCAS lower prices have been elevated this morning at the same time as prices for energy have been through the floor… shown here in a “NEM Prices Schematic” widget that’s been available in ez2view online for some years.
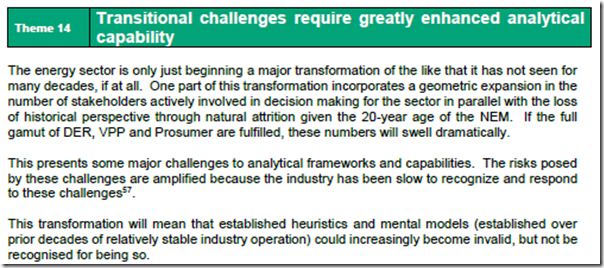
One more reminder that this energy transition is demanding that we all upgrade our analytical capability. Sadly the greatest gap is perhaps seen for a number of the newer entrants (because we have unfortunately allowed – or even encouraged – that schism (Theme 5 here) to emerge by way in which we have incentivised, and continue to incentivise, new capacity with not so much focus on capability).
Q4) What does all this mean for the Market Price Floor?
A final question to leave readers with today – what does all this mean for the Market Price Floor?
I can’t actually remember what logic was used when the NEM was formed in setting the price floor down at –$1,000/MWh. In the early years of the NEM (i.e. where there were very few instances of negative dispatch prices actually seen) it was perhaps ultimately a bit academic at the time. However as we progress into an environment where negative prices become much more frequent and an active part of a participants trading strategy (no matter what their technology), perhaps it is time to start asking more serious questions about whether the Market Price Floor should be lowered – and, if so, what to?
How would we even determine the “correct” answer to that question?


It’s interesting that you note renewables contract structure is such that it’s someone else’s* cost (and risk) when prices are negative – so are happy to sail through with their own revenue covered by some form of PPA independent of spot pricing.
The below article from earlier in the year outlined some of the issues with the distortion of the market due to government subsidies for renewables
https://www.dailymail.co.uk/news/article-7021119/Solar-farms-millions-taxpayer-handouts-make-selling-electricity.html
Great Article. It’s really confusing to understand why wind and solar bid so far into negative. It really highlights the need for bulk storage. in a fully developed market energy will be extremely cheap in QLD. competition between renewable and coal = cheap power.
Looking forward to seeing what new attacks our polies have on wind and solar. Hard to dispute the benefit here.
>It’s really confusing to understand why wind and solar bid so far into negative
When they receive so much money in subsidies and power purchase agrements, they can bid negative and still make money.
You can’t have competition between coal and renewables unless you remove those subisides to renewables that distort the market.
Seems much more that the CANNIBALISM that’s an inescapable feature of intermittents has begun in QLD.
Solar bids the price all the way down to -$1000/Mwh to compete for each solar plant’s hoped-for share of the favored dispatch they enjoy in the market that’s corrupted by government interference….to prop up intermittents.
It’s all artificial.
When the price gets so low and they either have agreements to switch off at that point as they’re propped up by government anyway…or they just decide it’s in their interests to do so…the solar farms just pull the plug…knowing the QLD GOVERNMENT will order coal plants to bid and generate to fill the gap even though it’s unprofitable despite the hedge..because if they didn’t….the lights would go out and everything would stop in QLD and the SYSTEM WOULD THEN COLLAPSE across the whole NEM…as forecast by the former AEMO boss…the late Matt Zema just before his death.
It would collapse because QLD coal plants…the newest in the country…. are all that’s keeping Australia’s East coast from being in SYSTEM BLACK now.
As Bloomberg[ BNEF] said…
‘Challenge for policymakers is to figure out how to pay for the bulk cheap RE units that run at close to zero marginal cost & ALL GENERATE AT ONCE cannibalizing their own energy prices-& at the same time keep conventional thermal plants online & available’.
How long will coal plants make themselves available in the OTHER states where they’re NOT government-owned and are subject to abuse-economic…material…real and verbal.