It’s been a pretty mild summer so far in Queensland, at least in terms of electricity demand.
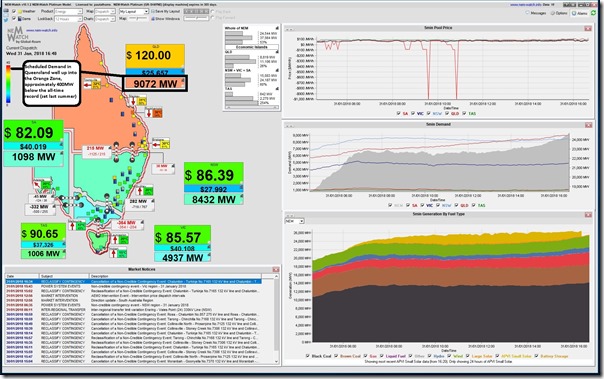
Schools are back in full flight this week, and I was just commenting to another parent this afternoon/evening at a school event (he also works in the industry) that the Queensland demand had not peaked above 9,000MW so far this summer – however I get home to see email alerts triggered by NEM-Watch v10 telling me that I had spoken too soon, because the Scheduled Demand in Queensland passed 9,000MW today (to 9,072MW in the 16:40 dispatch interval) – as helpfully recorded in the following NEM-Watch snapshot at the time:
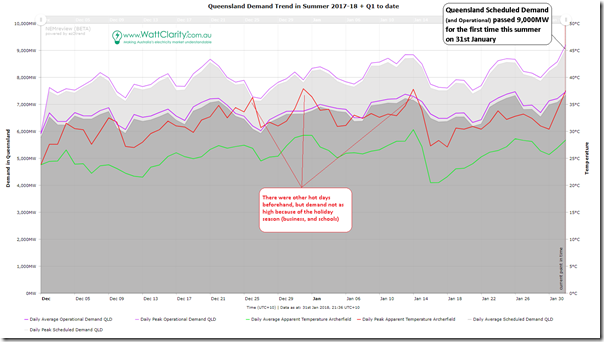
Given our keen interest in watching the NEM in our various dashboard products (NEM-Watch as general entry-level, plus more specific tools for different types of clients) I was pretty sure that the demand had not reached those levels so far this summer, but it was easy to generate the following trend in NEMreview v7 online, so I did to double check:
Turns out that (at least in this instance) my recollection was correct (NEMreview clients can access the updated trend here as summer, and Q1, progresses to see how demand levels evolve). I’ve flagged in the image here a couple of other occasions (26th December, 1st January and 14th January) where temperatures were about as high as today, but demand levels not so high (because of the “summer holiday factor”).
With curiosity driving me a little further, but at the same time running out of time tonight, I quickly pulled up our own residential consumption from 2nd December in our Solar Analytics dashboard (thanks guys – note that technical limitations mean I can’t show daily data for a longer range – seems to be limited to 61 days) to generate this trend:
Frequent readers will remember that I posted some personal musings about our own rooftop solar learning experience on 7th November.
On this mash-up chart here, I’ve noted the peak consumption days over the range, and am interested to note that they don’t completely correlate to the 3 days noted above when daily peak temperature in Archerfield was highest. Of course other factors will have been at work (e.g. were we home much during those hotter days, for starters), but at face value this is a good illustration of the complexities involved in electricity demand.
One final comment before signing off, tonight – electricity prices in Queensland today have been very subdued (as with summer, to date). Today the highest dispatch price also correlated with the highest demand in the above snapshot at only $120/MWh – which would have been thought highly unlikely beforehand, given prior summer experiences in recent times…


Be the first to comment on "Queensland’s Scheduled Demand for electricity topped 9,000MW today (Wed 31st Jan) for the first time in summer 2017-18"