
With all the active discussion surrounding the unique energy pricing patterns within the National Electricity Market this winter season (including here on WattClarity, about Q2), I thought it might prove useful to provide a quick debrief on how the weather side of things have gone so far this year. In particular, I’ll show the state of temperatures so far this year in Melbourne, as well as what climatic factors have been driving the weather patterns this winter season – and what is still yet to come for the NEM.
Winter 2016 (so far) in Melbourne
A good place to start for winter temperatures is in Melbourne, and I’ve done that by comparing Effective Degree Days in Victoria state so far this year vs. recent years. Effective Degree Days, or EDDs, are a common benchmark for approximating the weather factor in Victorian daily gas consumption – combining temperature, wind, cloud cover, and time of year into a single value that strongly correlates with daily gas demand when included with other non-weather factors (e.g. weekday vs. Saturday/Sunday).
The graph below summarises the observed EDD values of Winter 2016 so far, compared to a recent 15-year climatology:
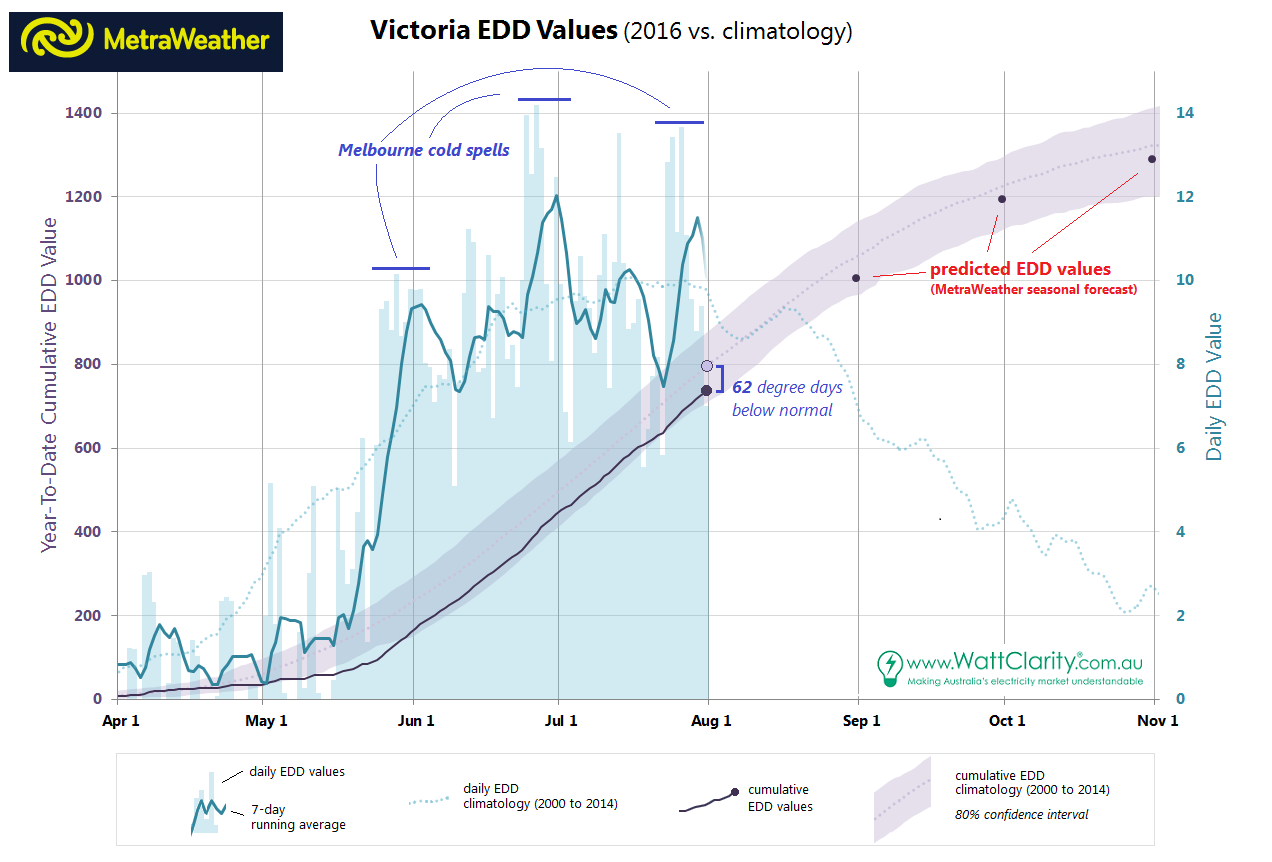
In terms of cumulative EDD values, July 2016 ended at a value that is 62 degree days below climatology, or about 8% below normal. In this graph, climatology is defined as the 15-year period of 2000 to 2014, in order to eliminate the warming trend of recent decades in Melbourne. In other words, this year’s warmer-than-normal winter in Melbourne cannot be fully explained by climate change alone, since the warming trend is minimal when looking only at the past 15 years. Indeed, other factors are clearly in play this winter, and are discussed below.
When looking at daily EDD values, there have been three distinct stretches of colder-than-normal temperatures this winter season. While the majority of April and May were much warmer than normal, daily EDD values have generally been at or above normal values since late May. In other words, the main culprit for this winter season being below normal overall is the lack of early-season cool spells, and has since “caught up” somewhat, with June 2016 best described as colder than normal for Melbourne, and July seeing near-normal winter weather conditions.
So what’s going on?
It is no coincidence that this late-May pattern change aligned with the ending of the strong El Nino event of 2015-16, and with the rapid onset of a negative Indian Ocean Dipole (IOD) event.
A breakdown of El Nino is typically associated with heavier-than-normal rainfall for south-eastern Australia, as well as above normal temperatures. This is precisely what occurred during the spring months this year.
However, the climatic factor that best explains this winter season’s weather pattern so far, as well as what is expected over the coming months, is the strong negative IOD event that quickly set up during May and June of this year. While both positive & negative IOD events have each historically occurred about once every five years, negative IOD events have been scarcer than normal in recent decades. Until this year, there had not been one since 2010, and you have to go back to 1996 to find another.
Looking specifically at the August-to-October timeframe, negative IOD events have a strong correlation with expected temperature and precipitation patterns across Australia. With regards to the NEM, it is evident in the Bureau of Meteorology maps here that maximum temperatures are significantly reduced for much of the Southern NEM, while minimum temperatures are largely unaffected. This lines up well with the above-normal precipitation that is seen during negative IOD events, which limits the potential for daytime heating, and also minimises the chance of cool mornings.
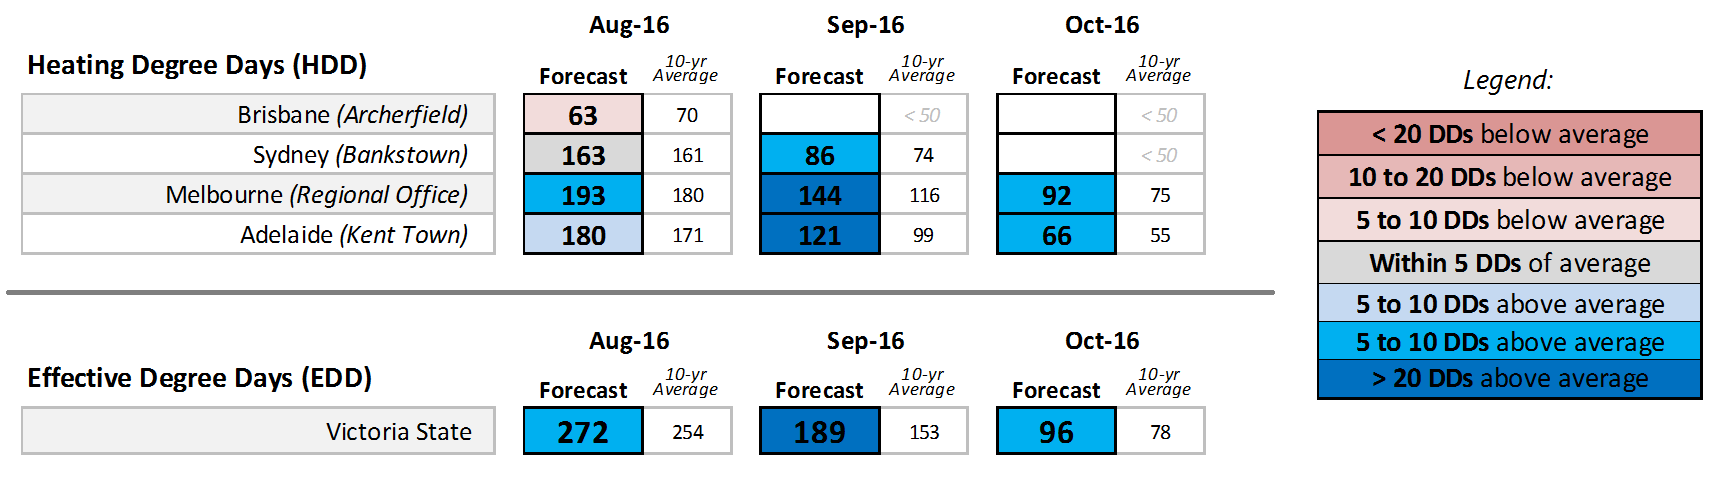
Looking ahead, our MetraWeather seasonal forecast predicts that these climatic factors will allow EDD values to continue their catch-up through the late winter and spring months, with colder-than-normal temperatures expected for August, September, and October.
What does this mean for Summer 2016-17?
MetraWeather will be issuing our next seasonal forecast this week, which will be the first issue that aims to quantify extreme hot days across the National Electricity Market.
This forecast is heavily affected by both the ongoing negative IOD event, as well as the potential upcoming La Nina event. The negative IOD event is expected to fade as Summer 2016-17 approaches, but more importantly, the potential for a La Nina event is the primary factor to consider when forecasting extreme hot days across the National Electricity Market
WattClarity® readers may wish to refer back to my prior notes here about extreme heat and ENSO.
About our Guest Author
|
|
Rob Davis is a Meteorologist who has worked with MetraWeather since December 2013 – and prior to that for many years with The Weather Network.You can find Rob on LinkedIn here.
MetraWeather is a world leader in the supply of weather data visualisation and automated prediction technology solutions to energy, broadcasting, retail and other industry clients around the globe. MetraWeather works with clients throughout the energy supply chain, providing specialised software, dependable high-quality forecasts and observational data designed to give customers the essential insights necessary for them to make timely and effective business and trading decisions. |

Be the first to comment on "How have weather patterns influenced Victorian electricity demand so far this winter?"