
Looking back on Summer 2014-15, peak electricity demand generally came in below most people’s predictions.
Editor’s Note – these predictions were reviewed here for NSW, Victoria, and South Australia – and predictions for Queensland yet to be published. Predictions for Tasmania were more on the money, but the region is not discussed in this article.
With peak daily demand strongly correlated to peak daily temperatures during the summer months, it is worth a look at how this summer’s temperatures fared.
One benchmark is to compare this summer to the previous one. Focussing on the NEM’s major population centres, Brisbane and Sydney can draw a close comparison to last summer, while it is safe to say that this summer had little in comparison to the heat-filled Summer 2013-14 for Melbourne and Adelaide.
But this shies away from focussing on the real issue: extreme heat. Was this year really as lacklustre in terms of extreme temperatures as it would appear? Let’s take a closer look, specifically looking at the last 10 summers across the NEM.
Brisbane
If there is one place that saw its fair share of extreme heat this summer, it is Brisbane. Frequent hot spells struck the region, with many days seeing heat persist well into the afternoon and occasionally even into the evening hours.
Taking a look at Archerfield Airport specifically, extreme heat was no stranger this summer. In fact, Archerfield Airport managed to hit 35 degrees on 11 occasions this summer, more than twice as many as the average over the last 10 years.
The graph below aims to dissect the extreme heat of the last ten summer seasons (October to March). Each line represents a single summer, and its plotted values represent how many days surpassed any specific temperature during that summer. This graph can be used to see if any given year, including the summer that has just finished, behaved similarly or differently to any other given year, as well as if it was above or below average when compared to the last ten years.
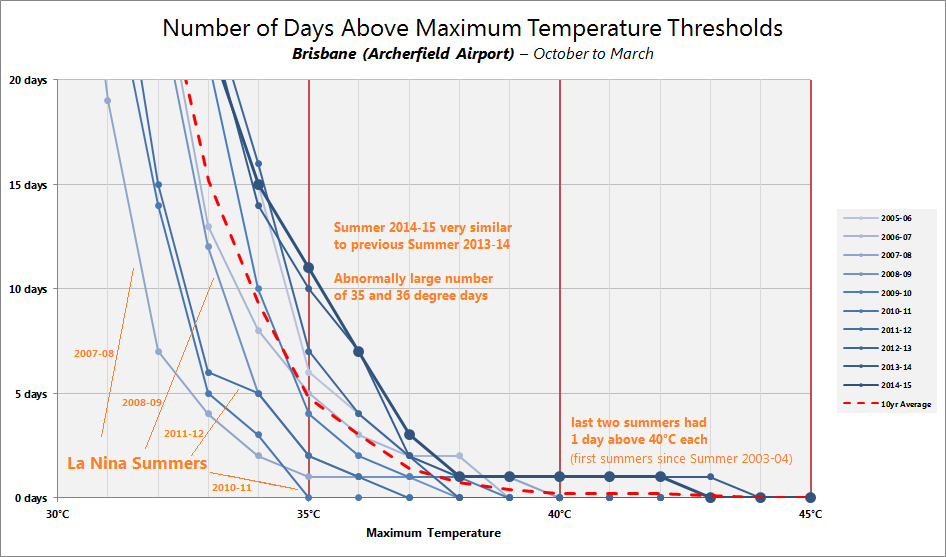
There are two distinct observations that emerge about this year’s extreme temperatures at Archerfield Airport:
· Its strong similarity to Summer 2013-14’s extreme heat distribution
· the abnormally large number of days that climbed into the mid-30s.
Sydney
I have chosen the observation site of Bankstown Airport AWS as the most representative for the Sydney region for this analysis. As you can see below, this summer was a very middle-of-the-road one for Australia’s largest metropolitan area.

There are three years that stick out as going against the grain, and were three years that were heavily influenced by El Nino / La Nina events. Similar to the graph for Brisbane, this is an indication of the importance of predicting this Pacific Ocean phenomenon, particularly La Nina events, when attempting to foresee eastern Australia summer temperatures.
One thing to note about this summer was the abundance of warm days that occurred very early in the summer period and were notably lacking in humidity; a fact that was mimicked by the previous summer as well. While temperature is able to explain a large portion of the story behind electricity demand, humidity is a second factor that cannot be ignored.
Melbourne
It will come as no surprise to many that this summer’s temperatures were below average for Melbourne no matter how you look at it.
Contrasting this summer with the one prior, they were polar opposites.

If looking for a summer to compare with, Summer 2011-12 comes quite close. Temperatures struggled to climb much above 35 degrees on most occasions, and the CBD failed to reach the 40 degree mark, an occurrence that hasn’t happened since Summer 2004-05.
Unlike Brisbane and Sydney, Melbourne’s summer weather is not as driven by El Nino and La Nina events. Indeed, some La Nina years have proven to be above average in temperature for Melbourne, and vice versa with El Nino events. There are other more complex factors that come into play when it comes to forecasting extreme weather in Melbourne.
There were early indications that Melbourne’s summer would fall into the cooler-than-normal category. Extreme heat predictions for the NEM’s major population centres usually start with Australia’s interior and how it will interact with the weather systems that track across the country over the summer months. Climate models consistently suggested that Australia’s interior heat would be largely sent eastward, as strong westerly wind anomalies were predicted. This meant above-normal bouts of heat for eastern Australia, particularly for Queensland. In stark contrast to Summer 2013-14, this also meant a lack of heat events for the southern NEM – especially for Melbourne – as there would not be the strong low pressure systems to drag the heat southward.
In a nutshell, it was predicted that Melbourne would be robbed of summer heat, and instead it would be given to Brisbane. This forecast turned out to be quite accurate.
Adelaide
Adelaide’s Kent Town observation site came in below average this summer, but only by a fraction.
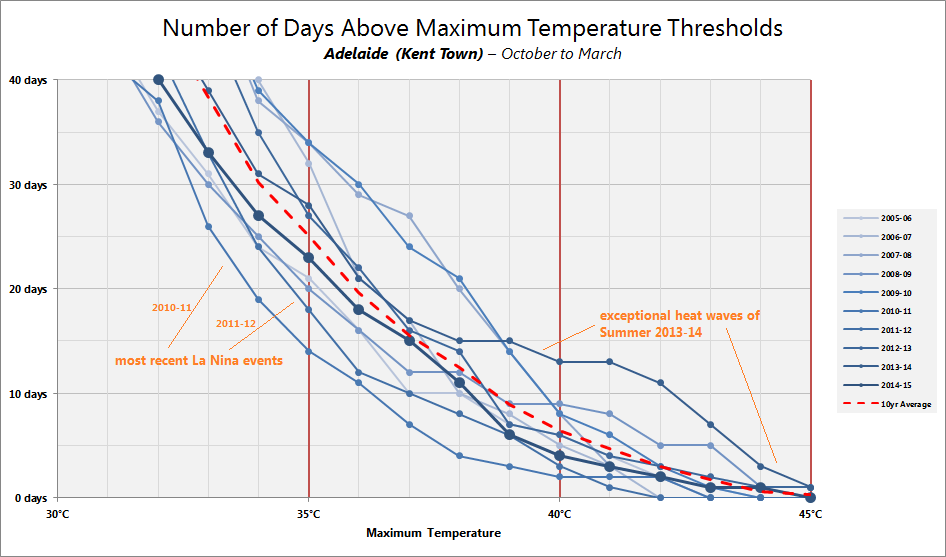
Last summer’s plentiful heat is well observed on the graph above, with 11 days climbing above 42 degrees. That is compared to only two days reaching the same mark this summer.
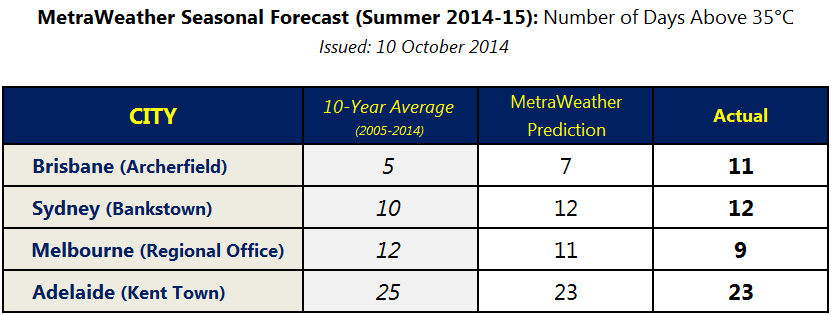
Seasonal Forecasting
The main topic of discussion leading up to this past summer was the high likelihood of an El Nino event affecting this summer’s temperatures.
This summer’s El Nino event was weaker than most computer model’s predictions, but MetraWeather also take other factors into account when predicting extreme temperatures in advance, and we’re really happy with how our seasonal forecast performed for this summer’s overall pattern of extreme weather.
Conclusion
Summer 2014-15 saw a near average amount of extreme temperatures across the NEM, with Brisbane seeing more than its fair share of extreme heat at the expense of Melbourne.
This was hidden by the fact that the previous summer had an unusually large number of extreme heat days in all major population centres with the exception of Sydney.
This analysis also shows quite clearly that the likelihood of a La Nina event is the strongest predictor of summer temperatures, particularly for Brisbane and Sydney. While not all La Nina events have translated to below normal summers, almost all below normal summers in the last 10 years have been La Nina years.
About our Guest Author
|
|
Rob Davis is a Meteorologist who has worked with MetraWeather since December 2013 – and prior to that for many years with The Weather Network.
You can find Rob on LinkedIn here.
MetraWeather is a world leader in the supply of weather data visualisation and automated prediction technology solutions to energy, broadcasting, retail and other industry clients around the globe. MetraWeather works with clients throughout the energy supply chain, providing specialised software, dependable high-quality forecasts and observational data designed to give customers the essential insights necessary for them to make timely and effective business and trading decisions. |

Leave a comment