Spent an interesting day yesterday at a forum on the next challenges for ongoing market reform organised by the Melbourne Energy Institute and Centre for Market Design from the University of Melbourne.
There were some comments made about the low level of liquidity in the electricity derivative market here compared with electricity markets elsewhere. In the conversation that followed, it occurred to me that data on the volumes of trading of electricity derivatives on the ASX is not broadly available and understood.
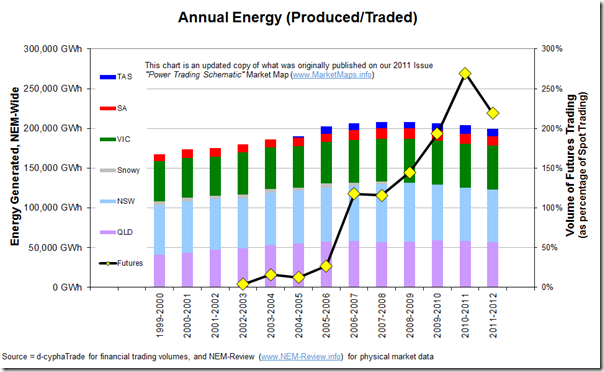
From our good friends at d-cyphaTrade, I was able to obtain the annual traded volumes on the ASX – and have compared this to the physical volumes aggregated with our NEM-Review software:
Note that this is an updated copy of the same chart which we originally published in our 2011 Issue “Power Trading Schematic” Market Map wall chart.
As can be seen, the ratio has been at 2, or above, for three years. This ratio is a commonly quoted metric to indicate the depth of liquidity in the financial market.
Interesting, we see volumes of electricity traded financially decline in 2011-12. There are three contributing factors that jump out at me immediately:
1) As can also be seen in this chart, demand has also been declining in the physical market for the past couple of years (with a number of contributing factors, including these). As a first order variable, this means lower requirement for hedging.
2) The declining demand has run in parallel with increased levels of price-subsidised generation sources which has all contributed to declining prices in the market – hence perhaps there has been a declining appetite, on the part of the physical participants, to hedge output.
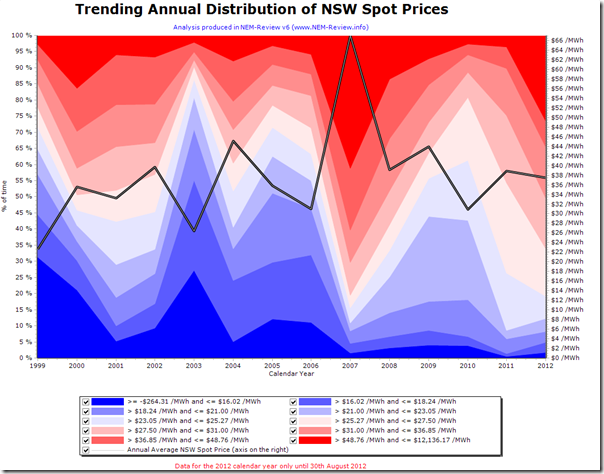
(a) These green subsidies (LRET for wind farms, and SRES + attractive feed-in-tariffs for solar PV) have had some effect on squeezing out thermal production but has been more significant in the effect on spot prices.
(b) The following chart (from NEM-Review) shows annual average prices for the NSW region as an example of this. The coloured distribution slices highlight how the instances of prices above $50/MWh declined from a high of 2007 (in a drought year) through until 2011. The level has picked up in 2012 due to the impact of the carbon tax from 1st July.
3) There’s also been a number of financial traders exit the market over the past 12 months or so – the ones that come to mind as I write this include JP Morgan, Optiver, Barclays, Ignition, BAML – and there’s no doubt others I have forgotten (note that it has not entirely been one-way, with some new faces appearing).


Just a question or two:
is there anything akin to shorting in this market?
if so, who is taking a short position and are any particular generators being targeted?
are there any accurate/reliable figures showing the total energy generated from all sources, as opposed to this figure for demand (in the NEM context) that you have used here?
Good work and thanks, Steve
Hi Steve
Thanks for the curly one – I’m not aware of this happening in the NEM, and can’t immediately think how it could happen.
Maybe one of our other readers can shed some more light on this?
Paul
Hi Steve,
Being a cash settled futures market, electricity traders sell futures just as easily or as often as they buy futures. There’s no physical supply obligation attached to an Australian electricity futures contract, so it’s not like buyers or sellers of electricity futures can “corner physical supply” via the futures market. There’s no limit to the size that the cash settled derivatives (futures and OTC) can grow to as a multiple of the electricity consumed in the physical pool market. Ultimately, any futures positions held open as at contract expiry (i.e. at the end of the relevant quarter) are cash settled against the AEMO pool price average across the underlying quarter. It’s still the marginal generator(s) that set the pool price every half hour during that period, regardless of how many futures contracts have traded or at what price those futures contracts traded. Hope that helps.
Dean.
Thanks Paul for the great summary.
If anyone would like to do further research on the Australian Electricity Futures & Options Market we freely publish a weekly Market Wrap (here: https://d-cyphatrade.com.au/market_wrap) and a bi-annual Energy Focus newsletter (FY12 can be downloaded here: https://d-cyphatrade.com.au/newsroom/energy_focus/energy-focus—-financial-yea).
Additionally, the online historical Data Centre includes all trades since Sept 2002 is available via an annual subscription here: https://d-cyphatrade.com.au/products/data_centre.
If anyone has any queries about the d-cyphaTrade ASX Electricity Futures & Options market please feel free to contact us on toll free 1800 330 101 or email info@d-cypha.com.au.
SSL Error
You attempted to reach d-cyphatrade.com.au, but instead you actually reached a server identifying itself as asxenergy.com.au. This may be caused by a misconfiguration on the server or by something more serious.
An attacker on your network could be trying to get you to visit a fake (and potentially harmful) version of d-cyphatrade.com.au.
You should not proceed, especially if you have never seen this warning before for this site.
Hi David
Thanks for pointing this out. The ASX bought out d-cyphatrade from the previous owners earlier in 2013 and renamed it ASX Energy.
Paul
What about the impact of vertical integration of the majors? Could this be contributing due to the natural internal hedges they have by owning generation assets or rights to generated power due to privatisation?
Hi Chris,
Yes, that could be a factor.
Uncertainty about the medium-term landscape that will apply for carbon pricing might also be an influencing factor – along with the 3 other factors mentioned above.
At the end of the day, it’s a market – hence we won’t know for sure the motivations of each and every participant who trades (or doesn’t, as the case may be) all of the time. All we can do is think through possible contributory factors.
Regards
Paul