
Background
“Earth Hour” was a concept developed by the WWF to promote awareness of the risks of climate change.
It first ran just in Sydney in 2007, and generated considerable interest, on both sides of the fence – with both climate change sceptics and climate change believers becoming very vocal about the value (or otherwise) of such an event.
Further information about Earth Hour is provided by the WWF on the dedicated website:
http://www.earthhour.org/
Here’s the description of Earth Hour on Wikipedia (and a more specific page set up for Earth Hour 2008) – and there are hundreds of other references (most of which we have not reviewed).
Since that initial event, Earth Hour has been held at the same time on two successive years, with an increasing number of locations around the world participating – and still continues to galvanise commentary by supporters and detractors alike.
Following the conclusion of Earth Hour 2009, out of interest we thought we’d have a closer look at what happened in Australia’s National Electricity Market over the period, leading to the preparation of these three articles:
- Earth Hour in the NEM 2007
- Earth Hour in the NEM 2008 (this article)
- Earth Hour in the NEM 2009
Disclaimer –
Please note that we’re not PhD-powered analysts/consultants in the energy market, nor are we climate change scientists (or sceptics).
We’re just a bunch of geeks who spend some time watching the electricity market with the software we’ve created. In the process of doing so, we make some observations, some of which we publish online here.
As such, we’re neutral about the usefulness of Earth Hour, as a concept – and about the climate change, in general. We’re the first to admit that we don’t have the background and training to even begin to add constructively to whether anthropogenic global warming (AGW) is happening, or not.
We are just aiming to maintain our software such that it continues to be useful in helping people to understand the electricity market – whatever form of carbon pricing it includes in future.
Plus we’re just curious…
We’ve published this information here as you may be interested, not because we believe it is definitive on the topic. Indeed, we fully accept that we may have overlooked a number of things (possibly big ones).
1) Background
2) Contents
3) Reported results
(a) Electricity Demand Reduction
(b) Other Results
4) Criticisms
(a) Amount of Reduction
(b) Journalistic Integrity
(c) Is it Significant?
(d) The difference between Symbolism and Real Action
5) Some numbers from NEM-Review
(a) The QLD Region
(b) The NSW Region
(c) The VIC Region
(d) The TAS Region
(e) The SA Region
(f) NEM-Wide Effects
Earth Hour in 2008 was organised between 8:00pm and 9:00pm on Saturday March 29th 2008.
Note that as daylight savings in NSW ended on 6th April 2008, this means that 20:00 NSW time equated to 19:00 NEM time.
This was unlike the case in 2007, when NSW had already ended daylight savings time on Earth Hour day. As a result, earth hour began 30 minutes earlier in 2008 than in 2007 (when measured according to GMT/UTC).
We suspect that shifting of the time of Earth Hour (from 7:30pm start to 8:00pm start, local time) was to do with ensuring that it was actually fully dark in Sydney/Melbourne/etc at the time – for Earth Hour to have its full intended effect. Indeed, this shift was continued in 2009, when Earth Hour was designated to start at 8:30pm (Sydney Daylight Savings Time). We have not sought to confirm this.
In the lead-up to Earth Hour 2008, an author named as “Gregoriancant” posted this interesting review of Earth Hour 2007 (which we should have read before we wrote our review of Earth Hour 2007, and saved ourselves some time)
The following table provides a summary of what we have been able to find from sources online:
| Across the NEM | According to this report from the ABC, NEMMCO reported that a reduction of at least 1000MW was seen over the period – however this was later revised down to 800MW as reported in the SMH |
| Sydney, and NSW | According to this article in the SMH, Sydney produced a drop in consumption of approximately 300MWh over Earth Hour (though it is not clear if this claimed figure was just in the CBD, or across wider Sydney).
The article also notes that:
According to the SMH, energy use dropped by 4.3% across the Hunter in Earth Hour 2008, and in Newcastle itself, it was reported that the reduction was approximately 9.4% |
| Melbourne, and VIC | In this article in the HeraldSun, the event resulted in a 10.1% drop in energy use across Melbourne’s CBD (quoting Citipower, the distribution company). We were not able to find a direct reference to this on the Citipower website, however.
The report also claims NEMMCO reported a 3.5% drop (state-wide) in electricity use during the hour. We have not found a record of this claim on the NEMMCO website, however. |
| Canberra, and ACT | In this blog post (quoting ActewAGL, the local distributor), it was reported that electricity consumption in Canberra reduced by 11.4% during Earth Hour.
We had a quick look, but did not find an original notice by ActewAGL – but we did find this report made in 2009 which re-iterated the results from 2008. |
| Brisbane, and QLD | We can’t find a direct report from Energex (the local distributor) – or anyone else in the industry for that matter – but this award citation does reference a 12.4% drop in energy usage in South-East Queensland for Earth Hour 2008. |
| Adelaide, and SA | According to this report (prior to Earth Hour 2008) it was anticipated that the reduction in consumption within the Adelaide CBD would be of the order of 10% – however we could find (in our brief search) no report of what the reduction actually was. |
| Hobart, and TAS | We could not find any report of a reduction achieved in Hobart, or other parts of Tasmania. |
| Perth, and WA | Western Australia is not a part of the “National Electricity Market” – however we have included some reported results here for completeness.
According to this report from Western Power (the transmission company) a 3% drop in consumption (or 60MWh) was seen across the south-west network. |
In more general terms, the results were as follows:
- Earth Hour went global:
- The WWF reports that more than 370 cities participated (up from 1 – being Sydney) and 50 million people (up from 2.2M) participated;
- Though (as noted below) it was noted that many of the world’s most populated cities did not participate in 2008.
- In the Australian context:
- According to these survey results, published by AMR Interactive, the 2nd event saw:
- A 59% participation rate in Sydney (about the same as the previous year);
- A 58% average participation rate across Australian capital cities (highest in Canberra and lowest in Perth);
- Compared with the previous year, a higher percentage of people doing more than just turning off their lights
This might indicate that Earth Hour was some success, at least, in helping people better understand how to moderate their energy use.
- We found, in the course of our searches the following references to individual company’s reductions (though note we were not specifically looking and so did not make direct reference).
- In this page, construction group Mirvac reports a 10.9% reduction in demand over a large number of sites in Australia and New Zealand;
- Ran out of time to find any more – but they were not immediately obvious!
- According to these survey results, published by AMR Interactive, the 2nd event saw:
Criticisms of Earth Hour 2008 began even before the event was actually held – the following are just some examples we found:
- Andrew Bolt featured (at least) twice in his criticisms of Earth Hour 2008:
- Prior to the event, in this article of 28th March, Andrew repeated some of the criticisms which had been raised at the end of Earth Hour 2007 (and which we have now covered in our review of the event), including:
- Referencing Media Watch’s criticisms of the “journalistic licence” taken with the “before” and “after” photographs in 2007;
- Referencing the analysis done by David Solomon to substantiate his claims that Earth Hour 2007 was “a flop”
- Claiming (without substantiation) that “the 10 per cent cut claimed for the CBD is itself a gross exaggeration”. Note that:
- We did see some vaguer claims, in some news reports, of a 10% reduction in “Sydney” (i.e. no mention of the CBD) hence it does seem that some other journalists may have been over-zealous (or perhaps just confused) in reporting the results;
- However, Andrew did specifically mention the CBD in his comment (above). Hence, if Andrew did have some basis for this claim, we would surely be interested in knowing more…
- Immediately after the event, in this article of 30th March, Andrew provided criticisms of the Earth Hour 2008 event along the following lines:
- Andrew begun by stating that Earth Hour
- If we assume that Andrew was looking for a reduction in the order of the 60% reduction (as planned for 2050), then he would be correct – however
- As the goal was a 5% reduction (which now neatly aligns with what is the 5% target suggested for 2020), then (as we discussed for Earth Hour 2007) the reductions achieved are significant, in that context.
- Andrew then took the creditable step of going straight to the source (the NEMMCO website) for some charts of demand (and price) on a 5-minute and 30-minute basis for VIC and NSW and notes:
- We agree that it’s very difficult to pick up a reduction of only raw data (especially a reduction between a “with Earth Hour” and a hypothetical “without Earth Hour” case).
- Again, if Andrew was looking for something like a 60% reduction, then he would rightly have been disappointed.
- For anyone else who is interested, we’ve included some charts (below, using NEMMCO’s trading target demand figures) that make it easier for the reader to form their own view of what the reduction was in each region.
- Andrew also takes aim at the perversity, during the event, of people generating more emissions than they saved as a result (by driving cars or flying helicopters) of wanting to have first-hand witness the spectacle in the CBD.
“resulted in no significant fall in power usage”
Please note:
“Nothing much there that I can see”
Note that:
- Andrew begun by stating that Earth Hour
- Prior to the event, in this article of 28th March, Andrew repeated some of the criticisms which had been raised at the end of Earth Hour 2007 (and which we have now covered in our review of the event), including:
- This industrious blogger (Andrew) did provide some analysis of NEMMCO’s data for 2008. However with respect to this review:
- Andrew references the chart initially referenced also by David Solomon, but later omitted (we presume because David saw it was not credible) to propagate the mistaken conclusion that Earth Hour encouraged an earlier increase in usage prior to the commencement of Earth Hour.
- Andrew’s charts also show data only for Saturdays in March 2008 – and so serve to propagate the same mistaken conclusion – our inclusion of data for Saturdays in April also (below) illustrates that the increase in demand prior to Earth Hour is a normal transition-to-winter variation.
Questions of journalistic integrity were again raised with respect to Earth Hour 2008. These included:
- As was the case with Earth Hour 2007, there were questions raised about whether the photographs used in “before” and “after” shots were authentic representations of what was actually the case – as we discussed this for Earth Hour 2007, we have not included further links here.
- More significantly, we noted this claim in The Australian on April 11th 2008 that
“JOURNALISTS at The Age yesterday condemned management for undermining the Melbourne newspaper’s editorial independence, claiming reporters were pressured not to write negative stories about Earth Hour”
This claim was also repeated in The Australian on April 25th 2008.
In this News Media blog, written by “Jack the Insider” on March 27th, the author raises a number of good questions about the Earth Hour initiative. In our view, the key points raised were as follows:
- The author makes the point that (for Earth Hour 2008)
- The author points to David Solomon’s analysis in 2007 (which we have already discussed here) to argue that the results from Earth Hour 2007 were not encouraging;
- The main point of the author (in our view) appears to be that:
- We agree that the results of Earth Hour 2007 and Earth Hour 2008 reinforce that the target of 60% reduction by 2050 will require massive changes in the Australian economy;
- However we note that the organiser’s stated 5% reduction targets are of the same magnitude as the possible (shorter-term) 5% reduction target by 2020 (which, from memory, were actually set after Earth Hour 2008, and hence is just a (fortunate?) coincidence). With respect to this target, the reductions achieved over the two successive Earth Hours do appear to have a greater relevance, as we noted previously.
- Jack’s final proposition is less antagonistic (and more reasonable) than that of other commentators:
“the most populace (sic) cities on earth; Shanghai, Seoul, Sao Paolo, Mumbai, Tokyo, Cairo and New York have stubbornly refused to play along”
– and, through this point, reinforces that the “big emitters” will need to be involved if there is to be any significant reduction in emissions. We note that this criticism was addressed in the following year, when many of the largest cities did participate in some way.
“the great myth being perpetuated by Earth Hour is that individual consumption of energy can somehow make a difference on a global scale”
which he clarifies as follows:
some currently debated policies that seek to reduce Australia’s greenhouse gas emissions by 60% by 2050. The Earth Hour experiment suggests quite strongly that small changes in individual lifestyle are unlikely to have a significant effect in achieving these goals
“So don’t expect me to be sitting in darkness on Saturday night. I won’t be madly burning fossil fuels with every light and appliance switched on either, as some Earth Hour protestors have advocated.
I always find solace in that old axiom: ignore them and they will go away.”
In this article written in the Australian on 29th March 2008, Matthew Warren notes that:
“The difference between one hour of candle-lit symbolism and genuine household action is vast.
Event organisers claimed 54% of Sydney residents took part in the inaugural Earth Hour last year, but surveys show that only 8% of households actually signed up to green power schemes, citing cost and time constraints. ”
(our emphasis added)
This comment sums up what is perhaps the biggest challenge of the climate change issue – the difference between professed principles and real action.
In his current position as CEO of the Clean Energy Council, we’re sure that Matthew will have (as one of his highest priorities) working to ensure a higher uptake – though, as we note here, it’s still not smooth sailing.
NEM-Review
In our review of Earth Hour 2007, we provided a single chart to compare the impact of Earth Hour on the NSW regional demand – when compared against other Saturdays in March and April 2007.
For 2008, given that it turned into a national event, we have included similar charts (below) for each of the regions. These have all been drawn in Excel with data sourced from NEMMCO (via our NEM-Review software product). For those who really want to delve into the detail, the raw data is still available from NEMMCO here.
For those who want to have a look at the numbers themselves, here’s our Excel spreadsheet.
Starting in the north, the following chart highlights how the QLD region demand trended over time during 29th March (“Earth Hour” day) compared with preceding and subsequent Saturdays.
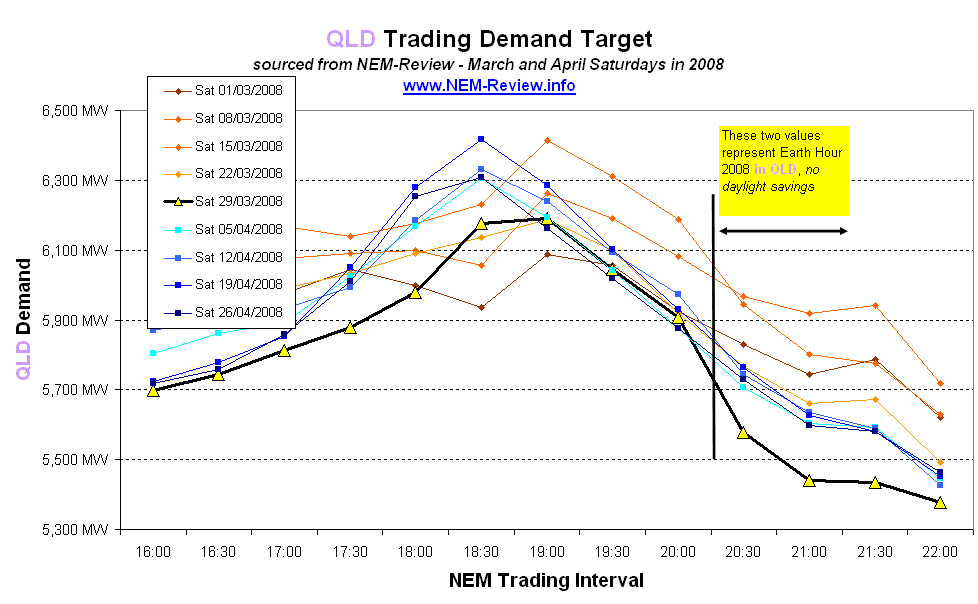
From this chart, an Earth Hour effect can be clearly seen – with a reduction of the order of 150MWh or so apparent.
The only report we could find (as noted in the table above) was of a claimed 12.4% reduction in electricity usage in South-East Queensland.
This would tend to imply that the majority of the 150MWh reduction (inferred above) was in the south-east corner (i.e. that country QLD did not participate in Earth Hour).
The second chart highlights how the NSW region demand trended over time during 29th March (“Earth Hour” day) compared with preceding and subsequent Saturdays.
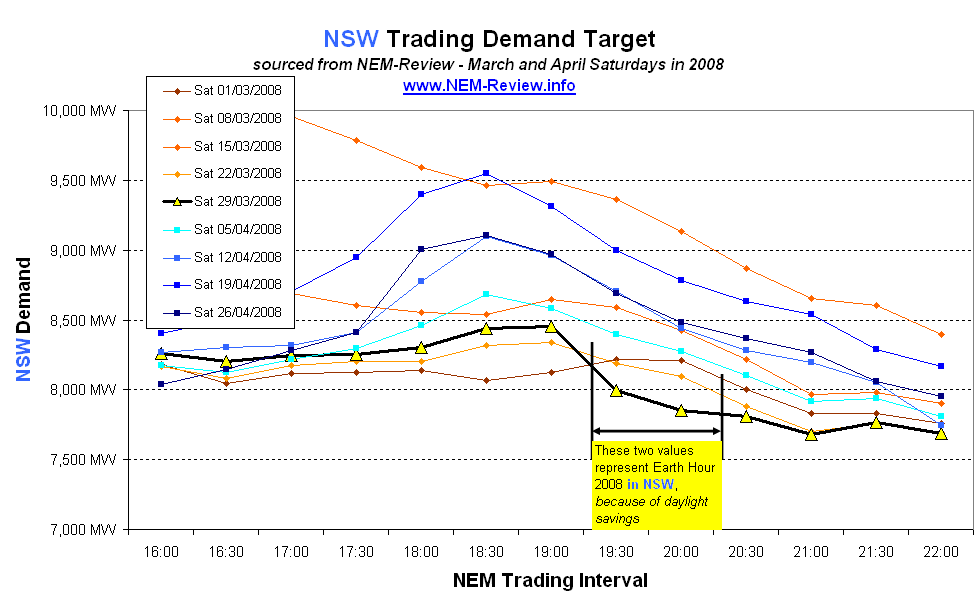
(For comparison, the same chart was included in our review of Earth Hour 2007 – with data for 2007, of course).
Note that, because NSW was still running under daylight saving, a 20:00 start (in this year) equated to a start at 19:00 NEM time, meaning the 19:30 trading interval is the first in which an impact would be seen.
From this chart, an Earth Hour effect can be clearly seen – with a reduction of the order of 250MWh or more apparent.
Compare this with the reported 300MWh reduction (in the table above) and this would imply that (as noted above for QLD) the city contributed the bulk of the reduction, and that the country areas did not contribute much at all.
Moving further south, the following chart highlights how the VIC region demand trended over time during 29th March (“Earth Hour” day) compared with preceding and subsequent Saturdays.
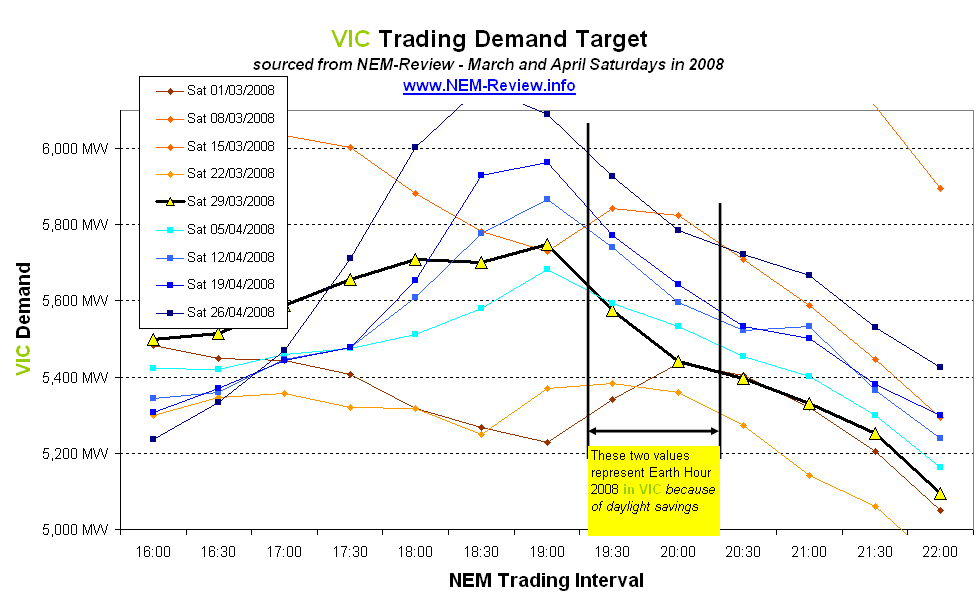
From this chart, it can be seen that the rate of decline in demand on the 29th was more rapid than the preceding Saturdays in March and the first Saturday in April – however the rate was roughly equivalent to the rate of decline shown for the latter 3 April Saturdays.
Hence, the impact of Earth Hour in VIC is less clear from this simple chart.
As noted in the table above, a 3.5% state-wide drop in consumption was reported. From the chart above, we can see that this would equate to a reduction of approximately 200MWh. This cannot easily be seen in the chart above (note that this is not to imply that the number is wrong, just that the shape of the load reduction on this Saturday and earlier/later Saturdays is too random to make such a reduction easily visible on the chart).
The following chart highlights how the TAS region demand trended over time during 29th March (“Earth Hour” day) compared with preceding and subsequent Saturdays.
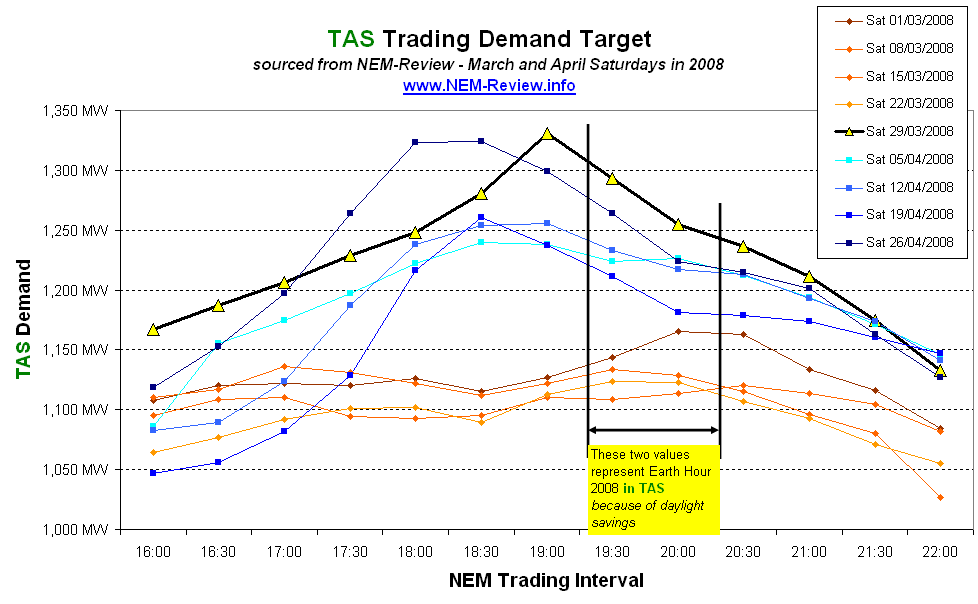
As with the case of Victoria, an Earth Hour effect in Tasmania is hard to clearly see in this simple chart.
Again, we could find no reports quantifying the energy “saved” and hence cannot comment any further.
We conclude with the following chart for South Australia.
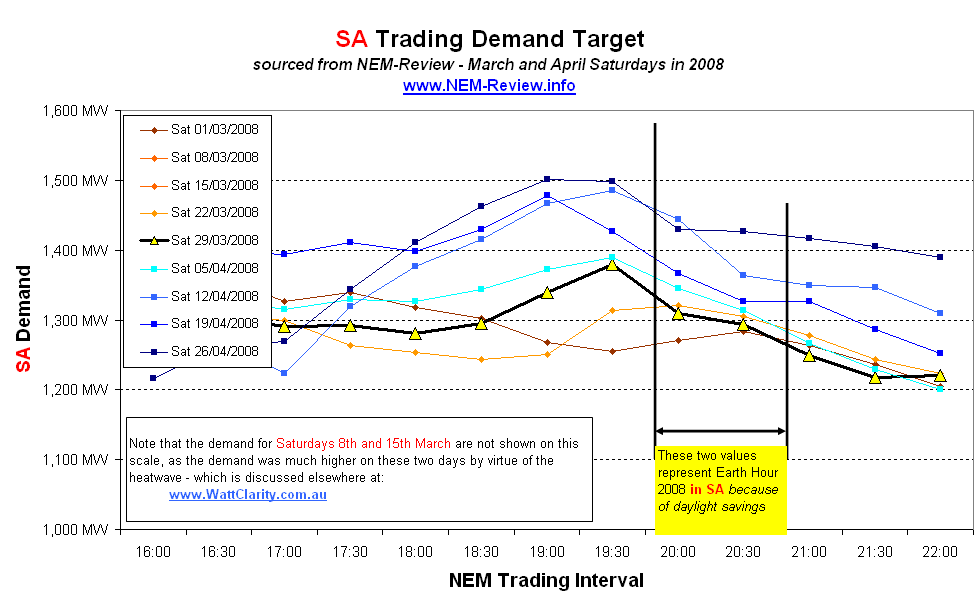
Note that Earth Hour actually occurred at a different time in the day (by NEM time) because of the 1/2 hour time shift to SA.
Some Earth Hour effect is apparent in the chart, though it is not as clear as was the case for QLD and NSW.
As with the case of TAS, we cannot comment any further – given that we could find no reports quantifying the reduction in consumption.
NEM-Wide Effects
To summarise, we have included the following chart for the whole NEM:

Some Earth Hour effect can be seen in the above chart, roughly at the same level as the 800MWh savings reported in the SMH:
- Note that in calculating this, we see a reduced demand of approximately 400MW or so in each of the 4 x 1/2-hour periods highlighted – which sums to 800MWh).
- Of course, our simple spreadsheet chart would be much cruder than the analysis NEMMCO would have undertaken to provide this report.
Leave a comment