
1) The NEM reaches 10
For those who are unaware, 13th December 2008 marked the 10th Anniversary of the inception of the NEM. We released a short review of NEM history on that day to commemorate.
Given the occasion, however, we thought it would be useful to have a look, in more detail, at what has happened over the past 10 years.
Taking a slightly different approach, we’ve opted to review each month at a time – hence, this is one of twelve articles posted on this site at the same time.
2) 10 years of January
Through the NEM-Review software, we have prepared this illustration of how (average and peak) NEM-Wide Demand for electricity has grown over the past 10 years.
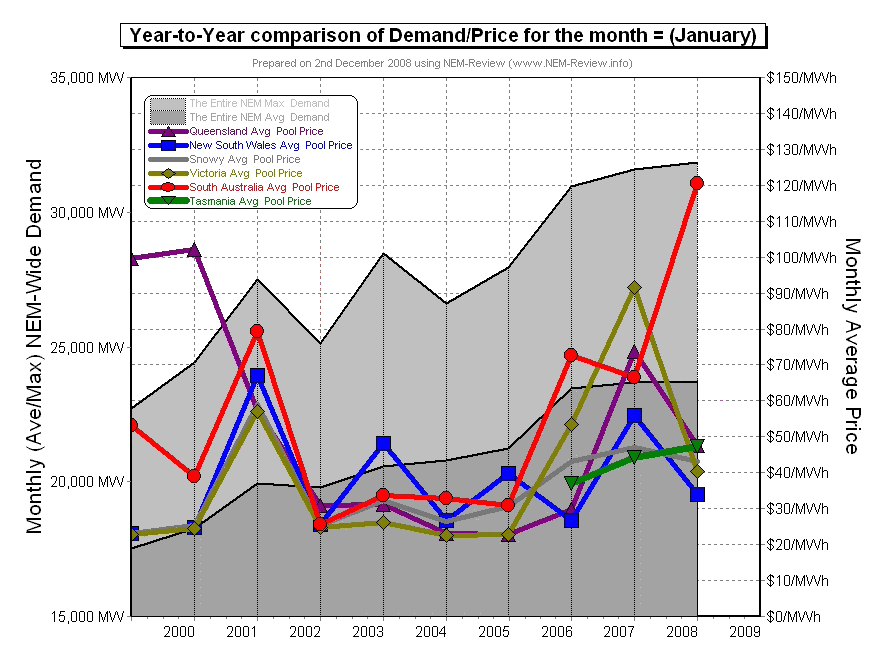
With respect to this chart, two things in particular need to be noted:
- Tasmania only joined the NEM in May 2005 – hence the data for January 2006 shows the effects of Tasmanian region demand for the first time.
- The measure of “demand” calculated in NEM-Review v5.3 is the (30-minute) Trading Demand Target, which is the time-weighted average of the (5-minute) Dispatch Demand Targets over the half hour:
- Hence, the demand shown here is an output from NEMMCO’s NEM-DE (Dispatch Engine) and not a metered demand. In most cases, the numbers will be very similar, but they will vary from figures quoted elsewhere for “maximum demand”
- This is further explained in the glossary on the NEM-Review portal.
3) Quick Links
As the following table is quite lengthy, we’ve included here Quick Links to each of the 10 years included in the table below:
- January 1999;
- January 2000;
- January 2001;
- January 2002;
- January 2003;
- January 2004;
- January 2005;
- January 2006;
- January 2007;
- January 2008
4) Each Year at a time
In the following table, we touch on the highlights of some of the January months that have passed, since the creation of the NEM.
|
January 1999 |
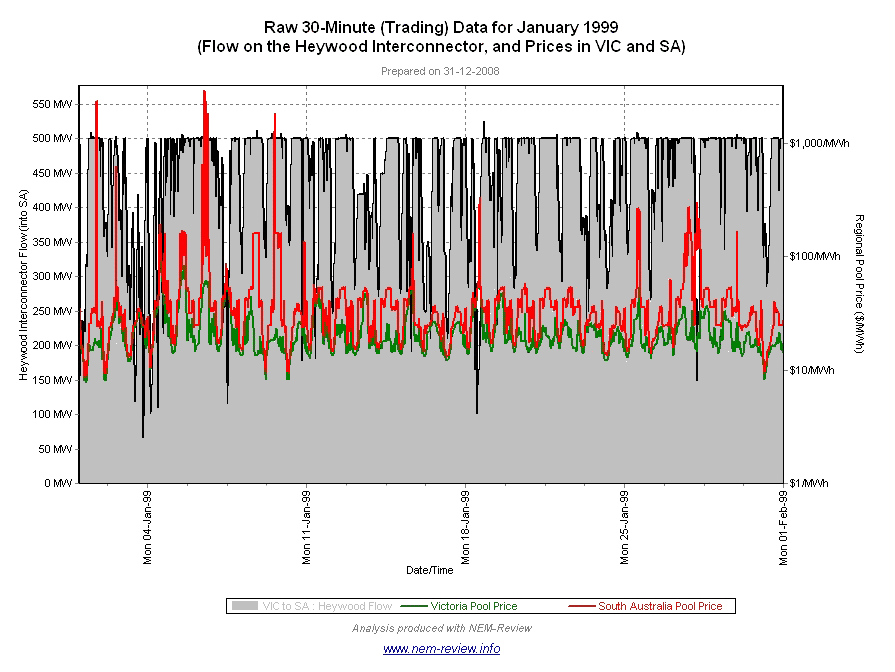
As highlighted in the diagram above, January 1999 saw prices in QLD separated from the other regions of the NEM, because of the absence of a physical interconnection at the time:
Prices in SA were also considerably higher than VIC, SNO and NSW, as well, because of constraints on the interconnection between VIC and SA. This is clearly shown in the chart here (from NEM-Review) which illustrates that prices separated (between VIC and SA) when the Heywood flow was around 500MW (the maximum transfer capability westwards).
|
||||||
|
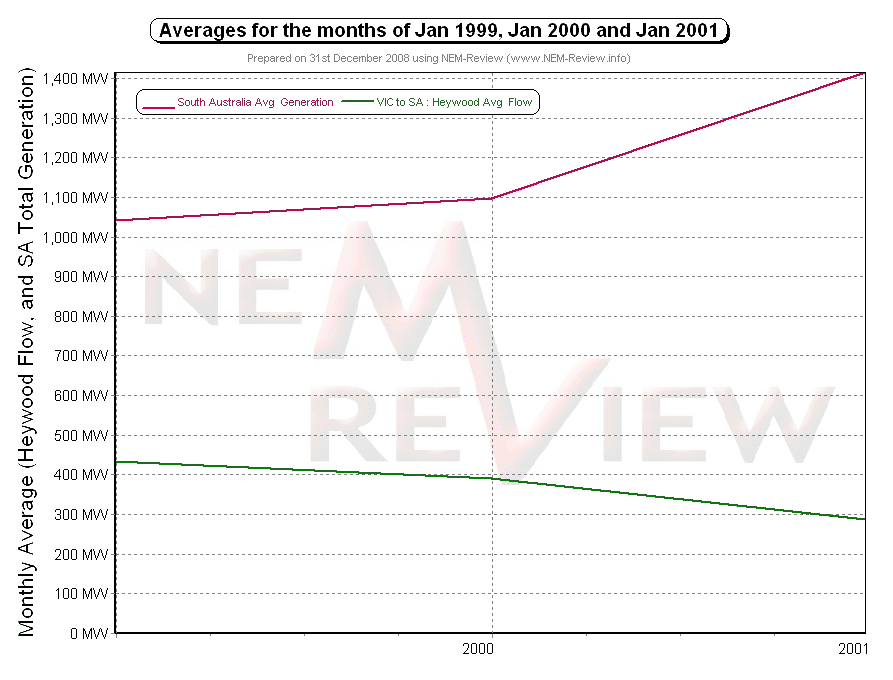
January 2000 |
The main chart above illustrates that not much had changed in January 2000 – in that prices in QLD and SA were still considerably higher than in the other regions. This was because the underlying conditions were largely the same. |
||||||
|
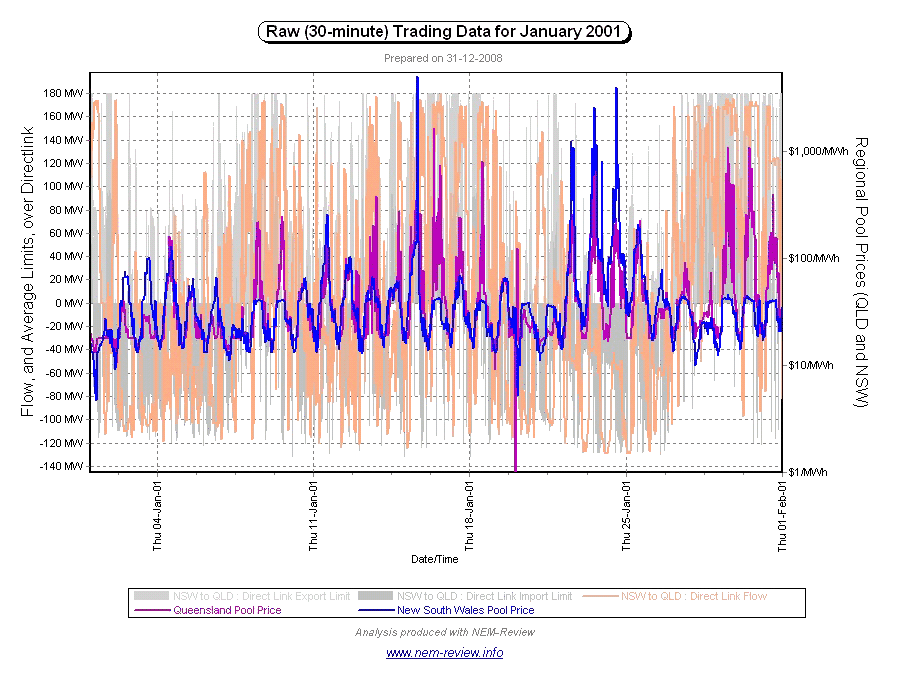
January 2001 |
The main chart above illustrates how a number of significant changes occurred in January 2001 (compared to 1999 and 2000):
There were a number of reasons why prices behaved the way they did, with some of the main ones being:
|
||||||
|
January 2002 |
Prices were considerably lower in January 2002 (in all regions) as:
However this did not totally eliminate price volatility – the following image (from NEM-Watch version 2) highlights one such occasion (12th January 2002), when QLD prices were separated from the lower prices in the southern regions for the 21/2 hour period shown in the summary.
This illustration has also been included to highlight the fact that the QNI interconnector was operational by January 2002. |
||||||
|
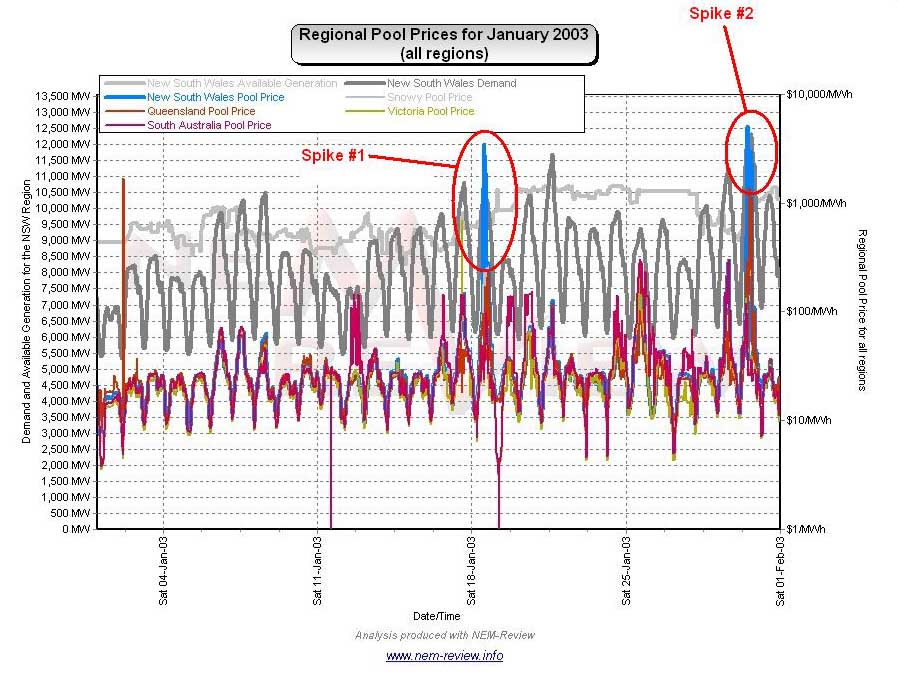
January 2003 |
In January 2003, we saw prices jump slightly in NSW (compared to the other regions) and demand spike considerably. This jump in prices in NSW was mainly due to spikes that occurred on two days: 1) A price spike on Saturday 18th January 2003 at 13:30 and again at 14:30; and 2) A more significant spike on Thursday 30th January 2003, when prices were above $1000/MWh for 6 trading (30-minute) periods in total.
|
||||||
|
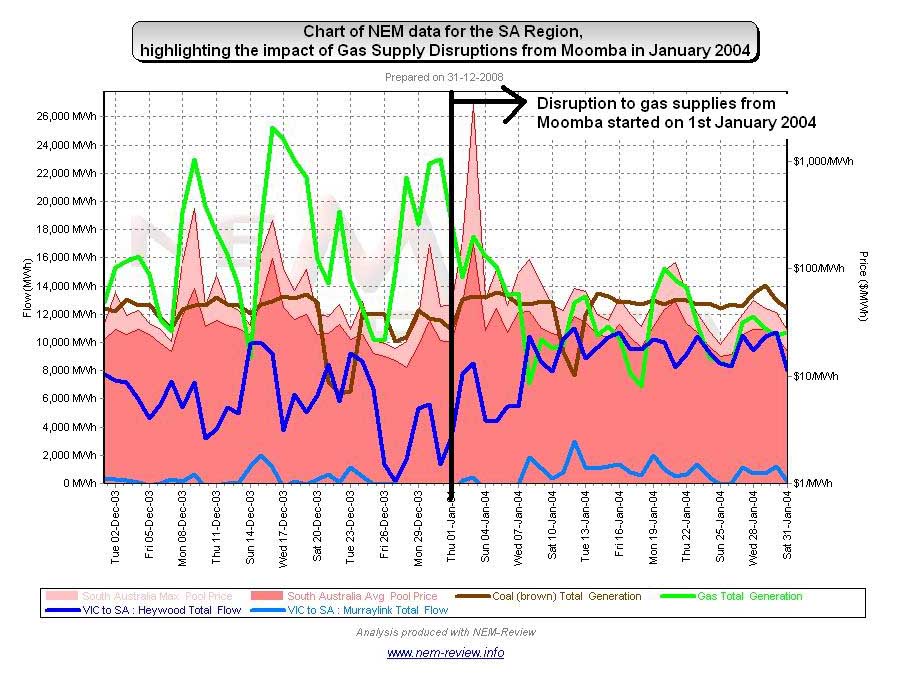
January 2004 |
January 2004 began with fires at Moomba curtailing supplies of gas from central Australia. We’ve previously talked about this outage as one of the 3 significant Australian gas supply disruptions over a 10-year period – in the context of an anticipated increase in gas-fired generation under the Emissions Trading System. Thankfully (from the point of view of the NEM), the commissioning of the new SEA Gas pipeline coincided with the outage. As shown in the following chart (from NEM-Review), total gas-fired generation in SA did reduce somewhat from 1st January 2004 – however the benefit of having back-up gas supplies from VIC available for the first time can be clearly seen.
|
||||||
|
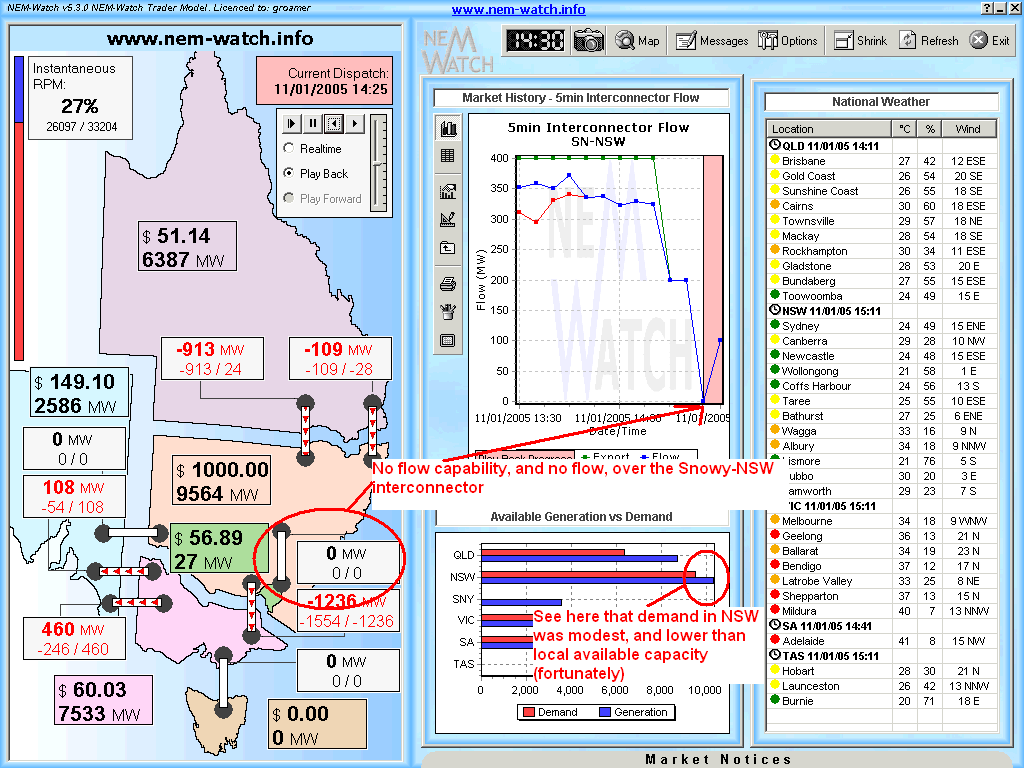
January 2005 |
As shown in the main chart above, prices were subdued (on average) over January 2005. Demand was up somewhat on the levels of January 2004, but still not as high as the peaks of January 2003. We’ve included the following snapshot from NEM-Watch (now version 5) as it captures a rare moment when the interconnection capacity from Snowy into NSW (either way) was zero.
Note in this version of NEM-Watch, we’d prepared for the commissioning of Basslink (later in the year) and also for the commissioning of the SNI link, which was proposed for between NSW and SA (but never happened). |
||||||
|
January 2006 |
As the main chart above shows, January 2006 featured an increase in price volatility, driving average prices up (compared to previous Januarys) – especially in VIC and SA. By this time, we had begun documenting some of the market events online (in a precursor to this WattClarity® service). We’ve since shifted this commentary into this site, and have linked a few interesting comments below:
|
||||||
|
January 2007 |
You would probably recall the events of 16th January 2007, when bushfires in the mountains triggered a major blackout in Victoria – which in turn affected hundreds of thousands of people and lasted many hours. We’ve previously prepared some analysis of what happened on the day, and links to external reports of the event, as well. |
||||||
|
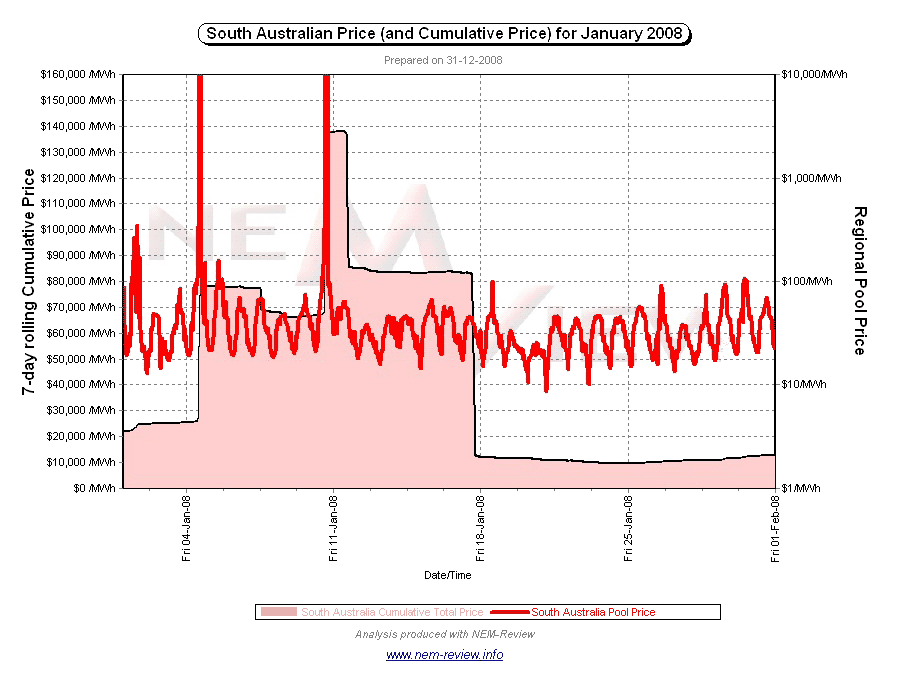
January 2008 |
It appears (now that we check) that we did not have the time to make any posts for the month (as the WattClarity® service was just starting to take shape in early 2008). As can be clearly seen in the main chart above, prices in SA were significantly higher in January 2008 than in January of any other year. There were several reasons for this, including:
The Australian Energy Regulator has published their AER Report for the price spikes that occurred on 4th and 10th January 2008 (along with some in February as well). As noted in this report, the 7-day rolling Cumulative Price for SA reached $138,000 during this period. This can be seen in the following illustration from NEM-Review.
The ability to plot the Cumulative Price was a new feature added to NEM-Review v5.3 in response to the high prices seen in SA in early 2008. Of course it wasn’t the only event of note in the market in January 2008, but it’s all we have time to include, for now… |
.png)
Be the first to comment on "January in the NEM (a review of 10 years of history)"