
- Why we’ve put this together
- Why a “Cheat Sheet”?
- most of the wholesale market participants (the generators, traders and retailers – who, you would expect, would have a good shot at nailing this answer) and
- a wide range of market observers (some of whom would freely admit that they are not “NEM experts”).
- Growth in Peak Demand
- A bit about IRPM over summer
- In December (in 2005-06 and 2007-08); and
- In March (in 2006-07)
For those who weren’t aware, summer 2008-09 has seen us relaunch our “Who’s the Best Demand Forecaster in the NEM” competition.
Of particular interest, this year we’ve also resurrected this 6-burner BBQ as a prize, so we expect the competition to be heated (apologies for the bad jokes).
Since 2000, our business has grown to the stage where we serve hundreds around the country (and internationally) who have some involvement in (or at least an interest in) Australia’s National Electricity Market (NEM).
In particular, we provide software to:
To even up the playing field, a little, we’ve included this analysis of the levels of demand achieved in recent summers.
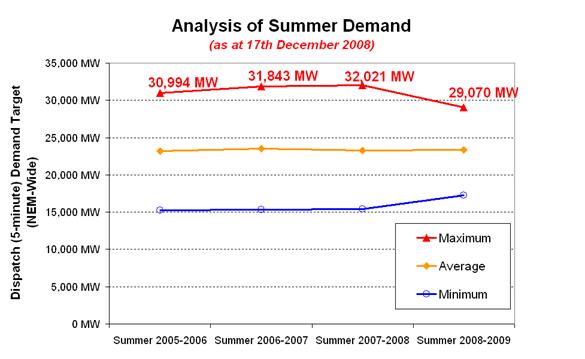
The following chart illustrates how peak demand has grown, on a year-to-year basis, since summer 2005-06.
Prior to that year, Tasmania was not a participant in the NEM, hence it was not possible to run the same calculation for prior years.
To provide further detail, we also looked at whole-of-NEM demand on a month-by-month basis over what we’re now calling “Summer” (December → March), to reveal this chart:
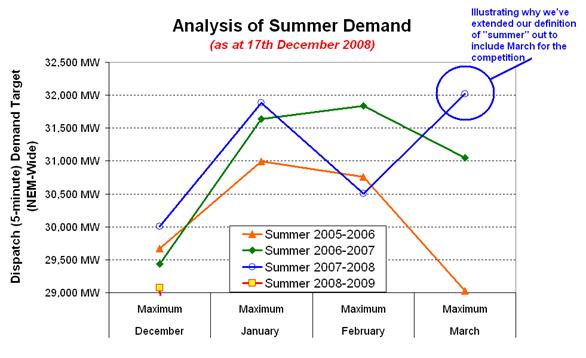
As is shown in this diagram, the heat wave that struck South Australia and Victoria in March 2008 had a pronounced effect on demand across the NEM during March.
Following from our analysis of the trend in NEM-wide IRPM, which we completed in July 2007 following a period of low reserves, we also thought you might be interested in these charts of what IRPM looked like over recent summers:
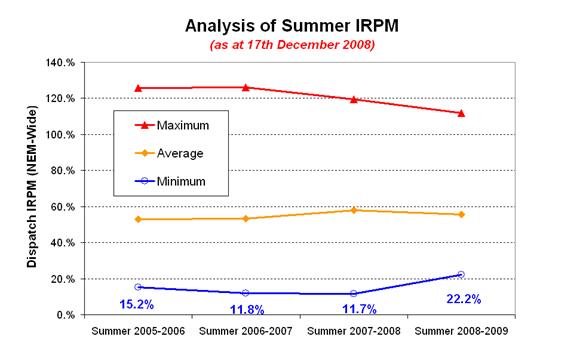
As can be seen, the lowest the IRPM has dropped to was just below 12% in each of the summers 2006-07 and 2007-08 (which was still a very healthy level, considering it was the lowest level it reached).
You might like to keep an eye on IRPM this summer (including the IRPM of individual “Economic Islands”) through NEM-Watch version 8, which was released in December 2008 – in time for summer.
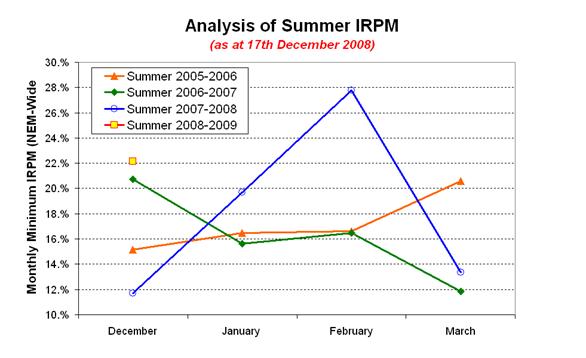
Interestingly, we note that (at least for the 3 years shown) the IRPM reached its lowest point over summer not in the months of January and February, but:
We’d speculate that this would be due to the generator’s scheduling of maintenance (ensuring that there is plenty of surplus capacity available for the traditional peaks in demand) – whereas peaks in December (early) and March (late) might be more unexpected, and coinciding with more plant on maintenance.
Be the first to comment on "A review of recent summers in the NEM"