Last week I had several reasons to be in-and-around Sydney for the whole week – which meant that, in between commitments with clients and others, I took a particular interest in the AEMO’s Low Reserve Condition notices (and notice about triggering the Reserve Trader), along with a bit of media coverage (and a few questions from journalists) about the tight supply/demand balance.
This week was certainly one which:
1) Generated considerable attention (understandably so);
2) Saw a number of overly simplistic identification of the cause of the tight supply/demand balance; but
3) Highlights some challenges ahead in this ongoing energy transition – both in terms of what physically happens in the grid, and also in terms of how we (collectively) view and understand what’s happening.
I’m travelling again much of this week, but have put together the following summary as the questions I received through last week suggest that this might be of interest to those who asked the questions – and could be for others as well.
(A) A brief summary, day-by-day
Given that it was a very busy week (both for us as a company, and for the broader National Electricity Market) I have tried to summarise some of the key points from each of the days in this table.
Note that this table cannot hope to be comprehensive – and probably has errors (if you see any, please do point them out to help out other readers – or, if you’re shy, let me know one-on-one). The same goes for the whole post, which has been pasted together in a few hours here-and-there snatched in between our more direct role in helping specific clients.
The AEMO, AER and others will (I expect) put together far more detailed reports in due course. In the analysis we share on WattClarity, we seek to provide value by sharing insights sooner than would be the case if our readers were awaiting the formal reports from AEMO, AER and others. However readers need to keep in mind the possibility of errors and omissions.
In that light, we hope you will find this of value.
| What happened inside the market | Outside, but related to, the market | |||||||||||||||||||||||||||||||||||||||||||||||||||||
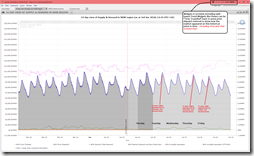
| Sunday 3rd June | I’ve prepared here a (web-based) Trend Widget in ez2view, and time-travelled back to 12:35 on Sunday 3rd June to show what market expectations were at the time:
(click on the image for a larger view) At that time, P30 predispatch had pushed out till 04:00 on Tuesday 5th June, and this is combined with the forecast from ST PASA to show the expectation that the week ahead would be fairly similar to the prior week. |
There were a couple things I needed to do in preparation for the training sessions that would come during that week – but certainly was not giving much thought to the supply/demand balance that would emerge through the week.
Ironically, there were a number of Market Notices issued over prior days about forecast LOR1 & LOR2 Low Reserve Conditions for Monday 4th June – but in South Australia not NSW. These look-ahead warnings had been cancelled prior to Sunday. |
||||||||||||||||||||||||||||||||||||||||||||||||||||
| Monday 4th June | Based on Market Notices we conclude that the period of Actual LOR was as follows:
|
I was in Sydney on the day, meeting with a range of clients (and prospective clients) – including new entrant generators, like the client we spend the day with the following day.
Through the day I was not playing close attention to the machinations of the market. |
||||||||||||||||||||||||||||||||||||||||||||||||||||
| Tuesday 5th June | Based on Market Notices we conclude that the period of Actual LOR was as follows:
* note that there was also a (related) LOR1 condition in the QLD region from 18:00 to 18:30. At 10:34 on Sunday 10th June, AEMO took the (infrequently used) step of issuing this media release about what happened on Tuesday 5th June. Particularly jumping out to me was this note: “As market and system operator, last week’s events in NSW are a sobering reminder that even outside of the traditional summer peak periods, there is still a need to ensure adequate resources are available to manage the system.” |
On Tuesday I was (with Jonathon Dyson) with a new client of ours, providing a full day training session on how dispatch works, and hence how prices are set in the NEM.
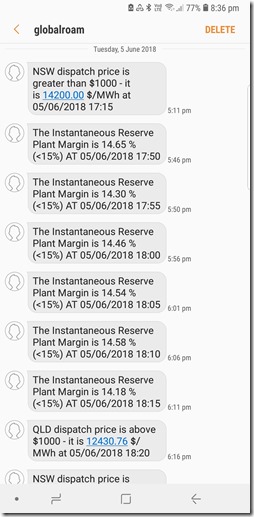
This client is a new generation participant in the NEM, and has adopted ez2view. We have learnt from experience that it’s best to provide this context in order that new entrants to the market can understand to use the software. We’ve also learnt that it’s best for us to incorporate the input of people like Jonathon (and Allan O’Neil) on occasions to provide the best value over a full day. Hence the unfolding events through the day provided an interesting backdrop to the content of the day. On the way back from the training session, I was inundated with SMS alerts noting both the high prices – but also (perhaps more interesting for me) notification of low Instantaneous Reserve Plant Margin (IRPM) NEM-wide for the time of evening peak. That’s something that really happens quite rarely (much less often than price volatility), as discussed below. |
||||||||||||||||||||||||||||||||||||||||||||||||||||
| Wednesday 6th June | Based on Market Notices we conclude that the period of Actual LOR was as follows:
|
Wednesday 6th June was day #1 of the Energy Networks 2018 conference in Sydney, which I was fortunate to attend.A number of the speakers made comments about the growing challenges that will come from the lack of visibility (and in some cases control) of distributed energy resources – which led to coverage and commentary in a number of places, like:
1) in the SMH on Wednesday 6th June with Cole Latimer writing that “Too much of a good thing: solar power surge is flooding the grid”. 2) on RenewEconomy (“ ‘Time to take control’ of rooftop solar, industry says” on 6th and then “What’s behind the scare campaign on rooftop solar ‘blackout’ threat” on the 7th, currently with 126 comments); 3) in “’ ‘Dumb solar’ threat to grid stability: Greensync’s Blythe” the Australian on 7th June, and We’ve long understood the need for more visibility of Distributed Energy Resources, and particularly battery storage systems – which is why we’ve been working with the Smart Energy Council for a number of years to create a national Energy Storage Register that is sustainable, and not a cost burden to those who don’t need/want it. As an interim step, information from our Battery Finder widget (now up to 211 makes and models) is now assisting the Clean Energy Regulator to populate their voluntary data collection process. We also understand that “control” is a more emotive and hence problematic topic on the continuum of the Emotion-o-Meter – even if you couch it in softer terms like “orchestration”. Another challenge ahead for the broader electricity sector (including all users) to reach a pragmatic approach as this energy transition picks up pace. |
||||||||||||||||||||||||||||||||||||||||||||||||||||
| Thursday 7th June | At 17:26 the AEMO issued Market Notice #63128 notifying of the “Intention to Implement an AEMO Intervention Event with RERT”. It flagged the possibility that they might dispatch the Reserve Trader from 17:30 to 18:00.
Based on Market Notices we conclude that the period of Actual LOR was as follows:
|
On Thursday I was at the 2nd day of the ENA’s “Energy Networks 2018” conference.
During the last session of the day, in between juggling messages about what was happening in the market, I was fortunate to catch an update from Flow Power about their particular approach to matching: 1) renewables-backed PPAs with 2) spot-induced demand response capability for the unhedged volumes. The comment that jumped out at me was that their volume of business had tripled in 18 months – it would seem that they are doing something right. I posted this article about the cessation of declining demand in NSW that evening, but also flagged on Twitter and LinkedIn about the Low Reserve Condition warnings by the AEMO. No time to do more that night… By 19:27, Peter Ker, Angela Macdonald-Smith and Mark Ludlow at the AFR had updated this article “Energy grid in crisis as winter power outages hit”. With respect to my comment on Demand Response on social media I am interested to (albeit later) read these paragraphs in the news article: “AGL and Tomago have a commercial agreement where decisions can be taken to reduce energy demand to minimise exposure to the spot price.” and: “Tomago, which is jointly owned by Rio Tinto, CSR and Hydro Aluminium, took a potline offline for 45 minutes on Tuesday, and two of its potlines offline for an hour each on Thursday.” This would go some way to explain what appeared to be demand response when I had inspected the NEMwatch image posted online. |
||||||||||||||||||||||||||||||||||||||||||||||||||||
| Friday 8th June | Based on Market Notices we conclude that the period of Actual LOR was as follows:
At 16:19, AEMO issued a Market Notice (#63152) indicating how cold & cloudy conditions, and hence the lack of solar PV, was another challenge they were dealing with: “Weather conditions across the Sydney basin are currently up to 7 degrees below the day-ahead temperature forecast, from all AEMO’s weather providers. In addition, heavier than forecast cloud cover has reduced the output of rooftop solar generation, resulting in increased demand. These deviations in weather conditions have resulted in increased actual and forecast peak demand for the NSW region. The current NSW operational peak demand forecast is 10,865MW at 1800hrs on 8/06/2018, as at 1600hrs 8/06/2018.” At 17:14 AEMO issued a Market Notice of “Intention to Implement an AEMO Intervention Event with RERT”, noting that this might be triggered between 17:30 and 18:00. |
On Friday I was outside of Sydney providing some training to a new client that’s come onboard recently. This client is becoming another new addition to those (invisible or at least opaque) spot-exposed Demand Response providers I spoke about here – hence they had great interest in what had happened on Thursday.
With the use of ez2view I was able to walk them through (using Time Travel) some of the key events leading up to the price spikes on Thursday – including (importantly) what the AEMO’s forecasts had indicated prior to the spikes occurring. On RenewEconomy, Giles Parkinson posted his article “NSW grid struggles as coal goes missing after bad trips”. Over at the SMH, Peter Hannam and Cole Latimer posted their article “Tomago Aluminium warns of ‘energy crisis’ as power supply falters” at 13:38 and later updated at 18:35. |
||||||||||||||||||||||||||||||||||||||||||||||||||||
| Saturday 9th June | Based on Market Notices we conclude that the period of Actual LOR was as follows:
. |
At 06:00, Ian Kirkwood of the Newcastle Herald had posted this article “Tomago Aluminium says NSW power grid in crisis” referencing the problems in NSW and comments made by the head of the locally-based Tomago Aluminium smelter. The article also included an image of our RenewEconomy-sponsored NEMwatch widget which readers can find live here, here, and many other places (no charge to embed on your own website).
At 17:38 on Saturday 9th June, Andrew White at the Australian published this article “Outages see power prices hit the roof” that includes some comments from me (provided Friday) about how much coal had been unavailable through the week. |
||||||||||||||||||||||||||||||||||||||||||||||||||||
| Sunday 10th June 2018 | At 10:34 on Sunday 10th June the AEMO took the (slightly unusual) step of posting this media release about what happened on Tuesday, as noted above. We presume there might also be a notice in train for Thursday and Friday? |
In between other commitments, I pieced together most of this analysis on Sunday 11th June to ensure I could concentrate on our “real job” of serving direct clients on Monday. |
If you know of other significant events I have missed in the above (and I have time to add them in) I would be happy to include them?
.
(B) Some particular observations
Building from the table above, we pull out a few key driving factors (again, remembering that this is far from complete) in order to highlight a few insights – both with respect to what happened last week but also (more importantly, in our view) pointing to more serious thinking that needs to happen on the route to this ongoing energy sector transformation.
(B1) It was a bad week for coal
A number of others have made this point frequently through the week, so I won’t labour the point here. Unfortunately some of those same people have slipped into an analytical trap of jumping from identification of one cause, to the assumption that it’s the only cause.
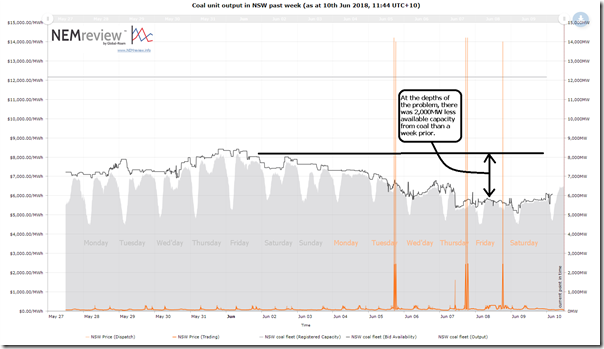
The following chart from NEMreview v7 sums up the scale of the generation fleet that went missing over the prior week (as I noted to Andrew White when he contacted me, there was about 2,000MW of coal-fired power that had disappeared from the supply stack over the 7 days to Friday 8th June):
Whilst it is understandable (and acceptable) that all plant needs to be maintained at different times, and logical that this would happen at a time of relatively modest demand, what is particularly concerning is the coincidence of forced outages.
This is certainly one (major) contributing factor to the tight supply/demand balance and high prices (a point strongly made by the “Coal Fail Twitterati”) – but it seems not to be the only one (something not really acknowledged by those same “Coal Fail Twitterati”), based on the analysis I’ve been able to do.
Given my background in Mechanical Engineering at thermal plant, and (decades ago) an interest in remnant life issues, I am very aware of the possibility that the rear lip of the “bathtub curve” of Forced Outage Rate might be making its presence felt with the older plant, exacerbated by the mess we have been making of this energy transition (which seems to me to be the main thrust of the concern raised by Matt Howell at Tomago Aluminium – as reported in the AFR, SMH, Herald, Australian, and elsewhere).
I know that others have been quick to give their verdict on that case – however I have not yet had time to perform a detailed analysis of the numbers (it’s more complex to do properly than might initially seem) so can’t say either way.
(B2) Gas-fired generation helped at peak, but had availability challenges
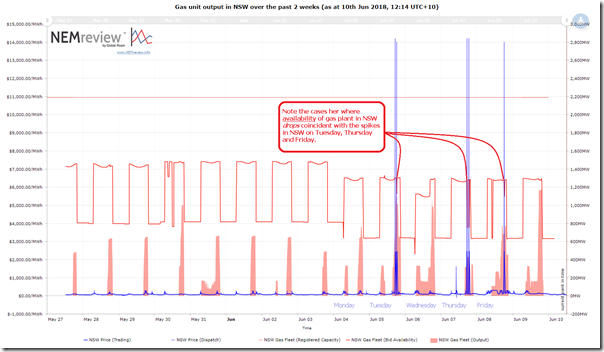
Coupled with problems at a number of coal fired plant, we saw the gas-fired fleet in NSW experience dips in availability around the time of the price spikes – as shown in the same 14-day trend from NEMreview v7 :
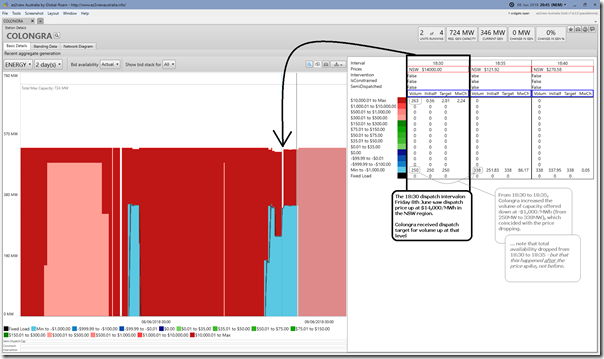
Utilising the (under intensive development) “Station Details Widget” within our ez2view software (v7.4.2) and focused on Snowy Hydro’s gas-fired Colongra peaking plant for the two day period Thursday 8th June and Friday 9th June (particularly singling out the price spike to $14,000 at 18:30 on Friday 9th) we see that the plant had about 250MW offered down at –$1,000/MWh at the times of both evening peaks:
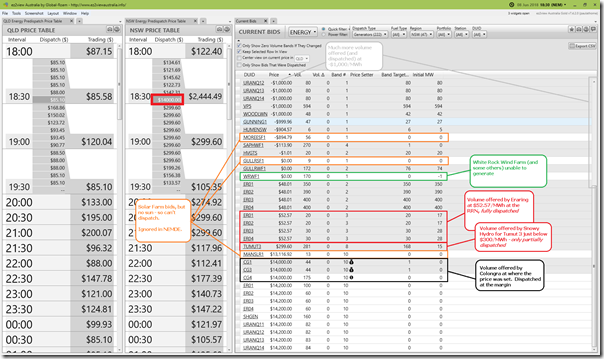
Another picture from ez2view juxtaposing 3 widgets in a window (like that which I showed to our clients on Friday, but to illustrate a spike earlier in the week) there was very little capacity offered in NSW between the volume offered by Eraring at $52.57/MWh (at the RRN) and the price-setting bids from Colongra at $14,000/MWh (at the RRN). This illustrates the reason why the price spiked so dramatically on Friday evening:
As highlighted, the capacity of solar and wind that was offered could not dispatch and the volume of generation offered by Snowy for Lower Tumut could not be fully dispatched because its output was being constrained (discussed briefly below).
I have not had time to check on the specifics of whether gas plant availability dipped at the time of the other spikes, contributing to them.
(B3) Hydro helped to “save the day” – but was subject to congestion
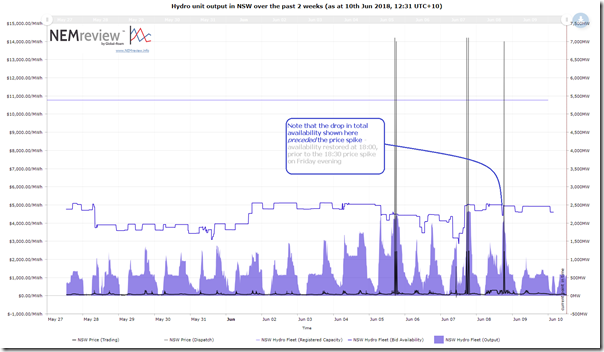
Utilising NEMreview v7 to again produce a 14-day look-back, but this time focused on Hydro resources in NSW (including part of the Snowy scheme) we see the output peaking up around the total of the capacity available at each of the three instances where the price spiked.
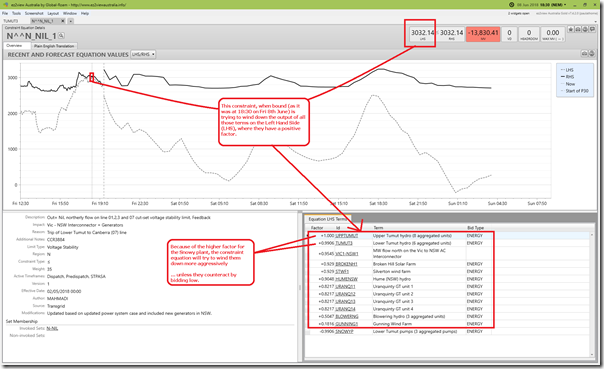
I noted that (at 18:30 on Friday 8th June) the TUMUT3 DUID could not be fully dispatched because it was subject to a bound constraint. A view of this particular constraint is provided in the Constraint Details view below:
This constraint (called “N^^N_NIL_1”) is a “System Normal” constraint (so invoked all the time) and will seek to wind down the output of all the elements on the Left-Hand Side when bound (where they have a positive factor). Snowy Hydro was effectively competing with flow north from VIC to get dispatched into the NSW reference node – hence this seems to be the reason why it would have offered so much volume down at –$1,000/MWh from 17:10 (i.e. prior to the spike) – though we do remember that we can’t know, with certainty, why they shifted volume thus.
A key point, here, is that (if this situation were to occur in future under similar circumstances when Snowy 2.0 were available) the amount of energy that could actually generate and make its way to market would not be any different than last week – without transmission augmentation. Certainly the same, too, for Tassie’s “Battery of the Nation” proposal for the same reasons. Both options would (in this instance) have no incremental value.
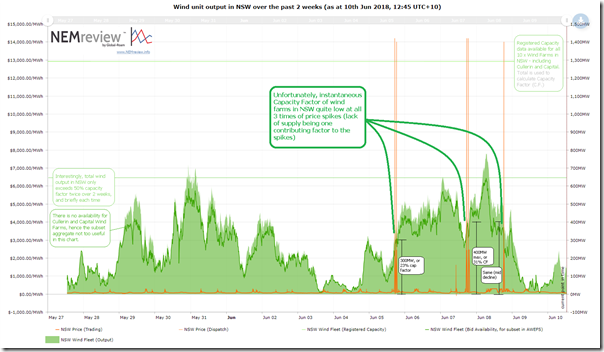
(B4) Wind output was lower over the entire 2 week period, and dropped at time of price spikes
Also utilising NEMreview v7 we look at aggregate output of wind across all of the NSW wind farms and see that the output was about mid-range compared to its range over the 14 days on each of the 3 occasions of price spike.
As noted in this chart, this 2 week period seems quite low (though perhaps not quite as low as the becalmed June 2017), with instantaneous output only rising above 50% capacity factor on 2 occasions over that 2 week period. As noted above, for instance, White Rock Wind Farm could not produce anything at the time of the price spike at 18:30 on Friday 8th June.
Hence an objective view of the plant that went missing would need to add the 1,000MW (approx) of wind capability that did not turn up at each of the three occasions when the prices spiked last week and the supply/demand balance was threatened.
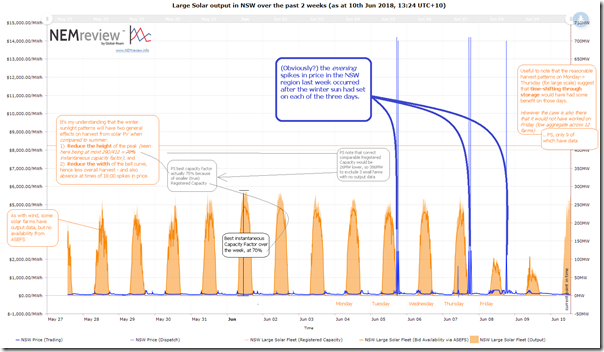
(B5) Solar harvest was particularly poor on some days, and not available at evening spike time
Again using NEMreview v7 we look at aggregate output from the growing fleet of NSW Large Solar farms over the same 14 day period.
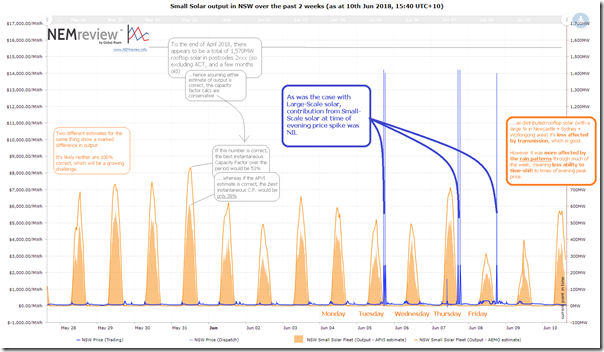
The obvious point to make, for a start, was that the spikes occurred each time after sunset – hence we knew in advance that solar would be contributing nothing. This was (understandably) also the case when looking at estimates for small-scale solar output in NEMreview v7 here:
In the case of small-scale, the analysis is complicated further by the opacity of distributed small-scale solar PV. This opacity will become a more significant (genuine) challenge for AEMO, the DNSPs and others moving forwards – which was why some comments were made about a need for visibility (and, in some cases, control) at the Energy Networks 2018 conference last week.
With a particular focus on last week, another observation can be made in that:
(a) The dispersion of large solar outside of the Newcastle-Sydney-Wollongong population zone meant that it was not affected, as much, by the broad band of heavy cloud cover and rain that affected Sydney through the week – though it might be subject to transmission congestion in the same way as was the Snowy units (discussed above); but
(b) The distributed rooftop PV, whilst avoiding possible transmission issues, was more highly correlated with the cloud cover and so more affected in that way.
Neither is a panacea.
As noted on the images, the effects last week are food for thought on the scale required to have dependable “time-shifting” of solar output that might, in future, be used to help address winter evening peaks in demand and correlated price spikes.
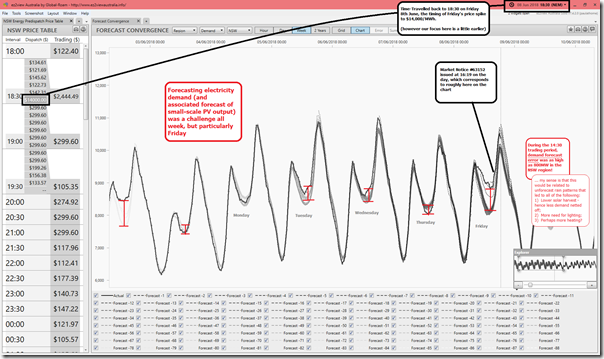
(B6) Demand was affected by the weather, and difficult to forecast
As noted above, AEMO issued a slightly unusual Market Notice on Friday 8th June noting the difficulties they were experiencing in relation to weather forecasts – and hence the linked forecasts for small-scale PV output, and electricity demand. Winding a “Forecast Convergence” window of ez2view back in “Time Travel” to 18:30 on the day reveals a startling picture:
As highlighted in the image, demand forecast error was as high as 800MW on Friday afternoon – which was a little under half the volume of coal missing on Friday, and also just lower than the volume of wind missing. Hence very material to market outcomes that day, and also all week. As noted in the image, I suspect that the weather forecasting difficulties compounded themselves by:
Factor #1) Meaning that projections for small-scale PV production in the Newcastle-Sydney-Wollongong were too optimistic, leaving more demand to be serviced by the grid (remembering this explainer about different elements of demand);
Factor #2) Because of cloud/rain cover, there also would have been a higher demand for electricity for lighting; and
Factor #3) AEMO mentions the cooler weather (7 degrees under forecast) which presumably would have meant for higher heating load.
One more challenge that the AEMO had to deal with, as they noted in their Market Notice.
It’s worth noting that the challenges with demand forecasting were most pronounced at the depths of the duck, and at time of evening peak in demand. Whilst the evening demand peaks were the times of the huge price excursions (Tue, Thu and Fri), prices were elevated throughout the day – hence getting the forecast “wrong” even at the depths of the duck would have had cost impacts last week.
(B7) Demand Response certainly did help
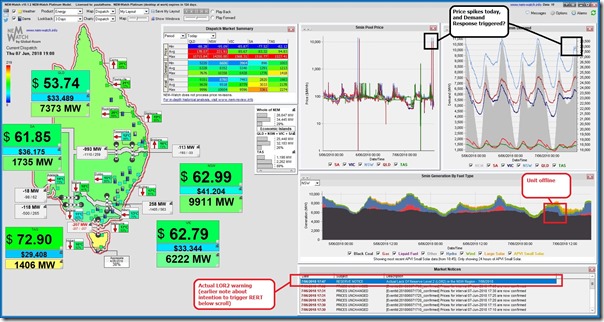
As noted above, I posted this snapshot from NEMwatch v10 on social media on Thursday night – though I did not have time to do much more than that at the time.
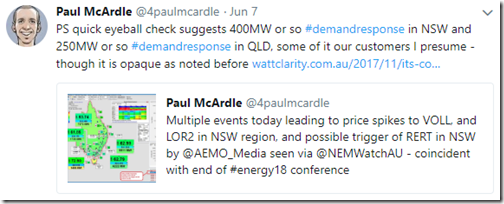
I did postulate on Twitter at the time that it appeared that demand response had triggered in both NSW and QLD at the time – presumably driven by the high dispatch price spike (and presumably also including clients of ours):
As noted in the media reports noted above, Tomago Aluminium smelter was certainly one of the energy users providing this demand response. We suspect that there were others of our clients as well – though, as noted before, this is opaque for a number of (quite reasonable) reasons. We have appreciated our role in helping to progressively growing the scale of demand response in the NEM.
However there are still many challenges for us (and some others) in continuing to grow this form of demand response in the NEM. These barriers are not the same as what some other commentators would propose. That’s food for another post at a later time…
(B8) Transmission limitations played a role
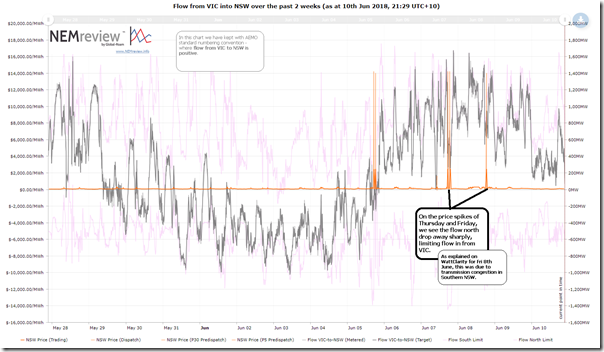
One more time using NEMreview v7, we look at the flow north from Victoria into NSW over the interconnectors (mainly) through the Snowy area over the same 14 day window:
As can be seen from the chart (and as illustrated above for the case of 18:30 on Friday 8th June) flows north from Victoria suffered from transmission congestion and the effect of market participants in the southern part of NSW bidding down at the market floor price to avoid being wound down in preference to flows in from Victoria.
This is an example of the type of congestion that will need to be reduced if the energy transition is to be successful with a vastly different topology of remote, large-scale generation sources. This was the subject of a number of sessions at the Energy Networks 2018 conference.
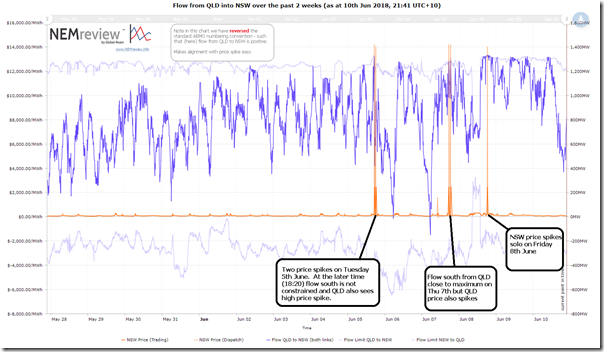
We use the same approach for flow south from Queensland (combining QNI and Terranora) and produce the following chart. To help our more novice readers we have reversed the typical AEMO number sign on interconnectors with this one – meaning that (in this instance) flow from QLD to NSW is shown as positive:
As highlighted in the chart, flows south from QLD were running at, or very close to the limit – possibly suggesting more interconnector transfer could be beneficial. However coupled with this, we note that 3 of the 5 price spike events in NSW also saw prices spike in QLD. Hence would need to assess in more detail before jumping to conclusions about the merits that an upgrade would have had last week, had it been available then.
There are a number of other factors we could look at, but I have run out of time to do this.
.
(C) Preliminary conclusions
This post has been thrown together with time pressure over the weekend, and probably has a number of errors included. In the process of preparing this analysis, I have been reflecting on some preliminary conclusions that could be drawn.
(C1) This was just one more example of the challenges of the energy transition
As noted by the AEMO in the media release provided on Sunday 10th June, last week was “a sobering reminder” that there is much to be done to ensure that the supply and demand balance can be managed into the future, as the energy transition picks up pace. The events of the SA Blackout of 28th September 2016 were one other obvious example, but there have been plenty more – some of which we have been trying to reference (as time has permitted) on WattClarity.
(C2) Industrial energy users are genuinely under threat
It wasn’t an accident that the CEO of Tomago Aluminium was quoted in 4 of the leading newspapers covering the NSW region, and further afield, with respect to what happened through the week. It also was totally understandable that our new clients whom I met with on Friday last week (another major energy user, also walking down the path of incorporating spot-exposed demand response into their procurement practices) was intensely interested in understanding just what was going on through the week. Both these businesses are under threat – with perceptions of increased risk to reliability, and increased cost pressures.
It’s important to remember that business use of electricity dwarfs residential use in the NEM – though you wouldn’t think that this was the case if you just listened to certain people in the energy sector who, when selling their preferred policy changes, like to spell things out in terms of increases in residential electricity user bills.
We know that our friends at Energy Consumers Australia (who we have worked with to provide this consumption widget), and in other advocacy organisations are very aware about (and concerned for) the plight of income-constrained residential energy users. We share their concern – but would reiterate that the concern is much broader than that, and encompasses the broader business sector (and particularly the industrial energy users who feature in our client base and are members of organisations like the EUAA and the MEUG).
It is critical that this energy transition is well managed – but we’ve been making a mess of it to date, for a range of different reasons.
(C3) There are multiple factors at play
It’s commonly noted that the National Electricity Market is a very complex integrated piece of machinery. What follows from this (though less often acknowledged) is that when there is a “failure” (or something that was too close to “failure” for comfort last week in NSW), it’s highly likely that there will multiple factors contributing to the predicament.
Even a cursory analysis over the weekend reveals that there were challenges last week with coal, gas, wind, solar, hydro, interconnection capability, demand forecasting and so on… For those serious about learning from last week to help make the energy transition really work, then this would be a reasonable starting point. Unfortunately others seem to want to continue to play a different game…
(C4) More distracting games on the Emotion-o-meter
Sad to say that I’ve grown to expect the (potentially distracting) shouting match that seems to ramp up in volume at both extremes of the Emotion-o-meter whenever stressful times like these emerge.
Despite the complexity (and associated near-certainty that multiple factors combine whenever there is “failure”), those at the extremes at the Emotion-o-meter seem to reduce everything to a single binary choice, based on a strongly held belief that “all of X is bad, and all of Y is good”, whatever those X and Y factors might be.
That’s not getting us anywhere closer to a properly managed energy transition.


A key thing that I believe is worth mentioning is that Tuesday night LOR was down to the Bannaby-Gullen Range transmission outage (they were cutting in a new substation), which reduced flows into Sydney by ~1000MW. This outage was supposed to finish at 17:00 but kept being extended, finally finishing at 19:15 or so.
I don’t believe that RERT was dispatched – there would have been constraints #RT_NSW1_OE/PE reflecting this. The decrease in demand following the MPC spikes was most likely Tomago pulling potlines, and the 2nd spikes due to increased demand which was probably them putting them back in.
Gas availability coincident with peak was Colongra bidding unavailable to avoid uneconomic start. Not sure I agree with how Snowy managed this in light of LOR2 – someone probably had a word with them given they ran on Friday night.
The SA LOR was due to some planned maintenance by ElectraNet to take a key 275kV line out which would reduce Heywood capacity to ~100MW.
Thanks HR. Hopefully not too many other things I missed in this summary.
“That’s not getting us anywhere closer to a properly managed energy transition.” While talking about your emotion meter and others stongly held beliefs you expose your own.