I’ve had a number of conversations with different people over the past couple weeks about the foibles of wind forecasts – all premised on the reality that, as installed capacity of wind farms continues to grow with the RET-induced boom in development currently underway, it’s going to be critically important to improve forecasts of their output over the coming 12 months.
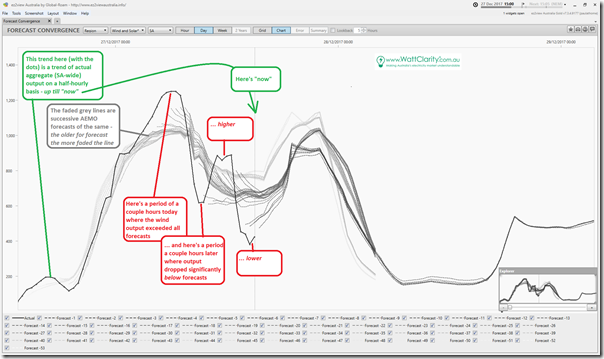
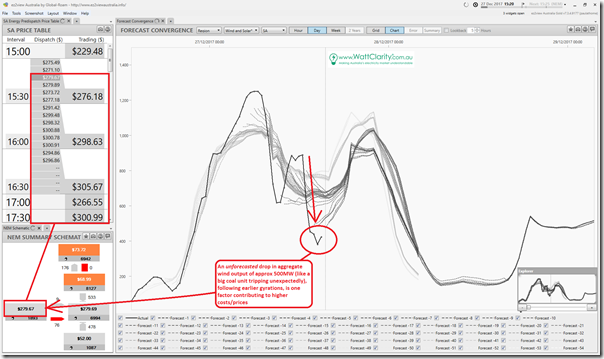
Entirely by coincidence, I was watching some major gyrations in aggregate output across all wind farms in South Australia today and thought it worth sharing the following snapshots from the “Forecast Convergence” widget within ez2view to illustrate:
As noted on the chart, this widget enables the user to see how AEMO’s successive forecasts have converged on actual outcomes – or, in the case of many half-hours today in the snapshot above, have significantly not converged on actual outcomes (which have proved much more volatile than the forecasts).
Frequent readers of WattClarity will remember that I have previously noted how forecasting is a mug’s game. This certainly applies to forecasts of market prices – but increasingly it also applies to forecasts of the lead-in variables that are becoming increasingly difficult to forecast in the increasingly complex NEM – variables such as:
1) Aggregate wind output, like above;
2) Aggregate solar output; and, partly as a result of these two
3) Region level “Scheduled Demand” forecasts.
Readers should be under no illusion that the AEMO’s task is easy in this respect – in fact, it seems to me that the AEMO’s task is simultaneously becoming even more difficult in future, AND more critical to the “keeping the lights on” mandate, at reasonable cost.
One of the more obvious reasons that prices in SA (and VIC) are high at present is because wind output is relatively low.
However what might be less obvious to many (hence has been noted on the second snapshot below) is that one of the factors driving higher prices is the poor level of predictability of output from the wind farms – because there is less certainty of what the wind will deliver, more (other) capability needs to be provided to deal with short-notice swings.
It’s already costing real money to energy users that forecasts are not as good as they need to be now – and these costs are sure to escalate in future as the installed capacity of intermittent plant grows.
We all should have a keen interest in seeing forecasts like these improve in future – and no-one should be under any simplistic illusion that “the problem is solved”.


If there were more points of input, would it get harder or easier? If all wind sources from now on are required in (hypothetical) law to have associated storage would that help? I suspect that more points would help but complicate the models and mandated storage would only add hysteresis at the cost of requiring oversupply built into the model at almost all times.
SA may be an outlier in terms of wind power predictability because much of its capacity lies in the hills near Adelaide, and wind there tends to have a very large diurnal variability, which means that it cannot be predicted solely from the spacings between isobars, which generally don’t change much over 24 hours.
Theory Alert (I’m not a meteorologist): The diurnal variability arises from air rising and falling as it warms/cools, a phenomenon known locally as gully winds. I’m guessing that localised vertical air motion is harder to predict than wide area horizontal motion caused by pressure gradients.
The total wind power must be some sort of sum of the local effects and the synoptic effects, sometimes with almost exact cancellation, so even if both parts can be predicted to within (say) 10%, when they are in opposition the error in their sum can be relatively large.
We have done quite a bit of investigation in this area with some promising results. The difficulties lie in the non-linearity of the problem.
The power output of wind turbines is related to the cube of the wind speed, so small errors get amplified. Above a certain wind speed the turbine output becomes constant, and for very high speeds the turbines may trip.
These characteristics vary from turbine model to turbine model.
Local topography also affects wind farm output.
For these reasons, meteorological schemes may be an insufficient approach because they necessarily sample wind speed measurements at discrete locations and extrapolate to areas.
We have been experimenting with approaches which approach the problem from a different angle.
Very interesting Paul, it’s also an illustration of the relatively high correlation of windfarm output in SA, with so much capacity concentrated in the mid-North of the State (the Hallett group 350 MW, Snowtown 370 MW, Hornsdale 315 MW plus Clements Gap 58 MW and Waterloo 130 MW also close by), obviously similar localised meteorological factors can affect a large proportion of the wind capacity in the state near-simultaneously. That clearly puts a premium on gaining a better understanding of what these localised factors are and if possible incorporating them into AEMO’s forecasting models – or perhaps just adapting the very short term forecasting models to better track actual rates of change seen in aggregate wind output, which they currently seem oblivious to.
That said I think that your comparison of the reduction in WF output to a large thermal unit trip – which can happen near instantaneously – could be misinterpreted. The latter has system security implications in terms of the fast-response contingency reserve required on the system, whereas the reduction in WF output happens much much more slowly than that from the perspective of real time operations (the reduction in the half hour up to 13:00 yesterday looks precipitous but was actually only about 20 MW/minute). Of course any extended change like this typically has impacts on spot price, just as do the ramps in demand associated with morning, evening, and (unnecessarily) “off-peak” water heating peaks.
Thanks for the comment, Allan
And thanks for highlighting the confusion I inadvertently might have caused some readers. The comparison with a big coal unit was to provide a comparison of scale – though each event has its own challenges. A trip of that magnitude is unexpected and quick, leading to short-term system security implications as you have noted. The unforecast oscillations (increases and decreases) in wind output is somewhat slower and so represents different challenges in terms of gearing up something(s) dispatchable to wind up and wind back at the same rate.
Well personally I don’t think this macro problem can be solved until all generators are restricted to only tendering power they can reasonably guarantee 24/7 all year round. However we wouldn’t want to start that process from here.
In the interim should wind farms be compelled to install perimeter wind monitoring and advanced warning anemometers to aid short term generation predictability and if so at what sort of distance (radius) would that be optimal for thermal generators to benefit from?
Excellent graphics Paul and an interesting discourse. A couple of comments if I may:
George in the shorter (5 minute) time frame storage can usefully be used to meet enhanced (by technologies such as lidar, skycam and cloud motion vectoring) forecasts. AEMO is exploring this with ARENA.
Climan: yup the best organisations to do short term wind forecasts are the wind farm owners and operators because they know the characteristics of their site best.
Bruce: AEMO produce non-linear generation power curves for every wind farm but due to the effects mentioned by Ciman these are not simple – especially for some farms (refer last comment).
Allan – in this discussion we’ve had wind generation congregated around the Adelaide hills and the mid-north. In reality it’s a mix. We do see pretty fast ramping events (up and then straight back down again) but they’re as fast as asset trips – but often larger. Solar ramping events are hellish fast though. The problem is combining a weather ramping event with another, or a demand ramping event or an asset contingency. These combinations have drastically changed the risk environment for system operators.
Great conversation people – keep it up.
Not as fast as asset trips
Not as fast as asset trips…
A not missing in there…
Yep, this sort of event would certainly give AEMO much bigger headaches and have higher cost implications if SA were not connected to the rest of the NEM.
As things are, I imagine a lot of the ramping capability needed to handle these large wind output swings would be supplied from outside SA over the interconnectors – one of the benefits of interconnection and its diversification of supply/demand.
Even so I would think there is enough ramping capacity and fast-start plant in SA itself to physically handle this sort of event. But as Mike points out, the risk environment for market participants and system operators is heightened because they would need to factor in the chance of this sort of unforecast event in order for enough of that capability to be available.
As I don’t know SA Topo, or places, do the BOM observations concur i.e. http://www.bom.gov.au/sa/observations/saall.shtml
click the place name for complete data, i.e. http://www.bom.gov.au/products/IDS60801/IDS60801.95678.shtml