On 7th November I posted these initial observations about experience with my own solar power station (informed by better data), and then on 20th November followed up with this top-down (NEM-wide) look at daily solar production through 2017, incorporating both small-scale (i.e. residential) solar PV and the few large scale plant operational in 2017 (most in NSW).
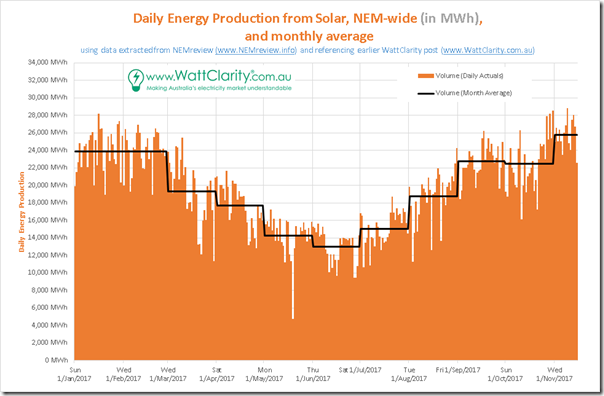
In the second post, we explored the significant underlying seasonal variation in solar output NEM-wide (i.e. so already accounting for significant diversity), with an additional daily variation layered on top. Here’s a chart that illustrates both of these:
Today (Friday 24th November) I’ve been asked to speak at the National Consumer Roundtable on Energy on the topic of battery storage – and I appreciate the opportunity to be involved. After all, there are very few consumers who actually buy energy just to stick a few joules on the mantelpiece – it’s what each of us do with the energy, as consumers, that is the ultimate reason for all of us to exist in the energy supply sector.
Quite a coincidence, as:
1) this week we also saw the release of a detailed (158-page) report titled “The Role of Energy Storage in Australia’s Future Energy Supply Mix”, as we noted here (worth also reading these comments by David Blowers at the Grattan Institute before taking what’s in that larger report the wrong way…)
2) we’ve also seen the start of a media frenzy with the end of the beginning for the Tesla/Neoen “biggest battery in the world (for now)” at Hornsdale (our popular “RenewEconomy Widget” is being upgraded to provide this visibility – you can currently see it in beta here, and it will be on other locations a bit later)
Now, astute readers of WattClarity might have clued onto the fact that I prefer to ground any of my thinking in numbers before speaking at events like the above (or posting online, like on WattClarity). Hence it was logical for me to try to use numbers to understand the scale of the challenge relating to storage we’ll require through this energy transition.
The challenge, in doing this with storage, is that there are not yet any real numbers that would point to how storage has operated historically (apart from the 3 existing pumped hydro plant, of course – but for the purpose of this exercise I’ll discount them in today’s discussion). This is one of the reasons why we’ll be watching very closely at the initial operations of the Hornsdale Power Reserve.
In the absence of real numbers for historical operations I had to make some up. There, I said it – so let me repeat, to avoid the apoplexy from either end of the Emotion-o-meter. What follows is a hypothetical scenario – so something that, by definition, is almost certain to be wrong. The reason I have done this is to help get my head around the scale of storage that might be required in this future world.
I started with an assumption that you’d not use storage to deal with the seasonal variability – it’s too big, in energy volume terms, so would be more cost effectively dealt with a combination of methods (but no “Magic Wand” as discussed further here). Without going down that rabbit hole of working out what that method might be, I reasoned that (whatever the method) it would probably help to have a bit more dependability on the variability of daily solar production within a given month. Stating this another way, I wondered how much storage would be necessary to even out the variability within each month.
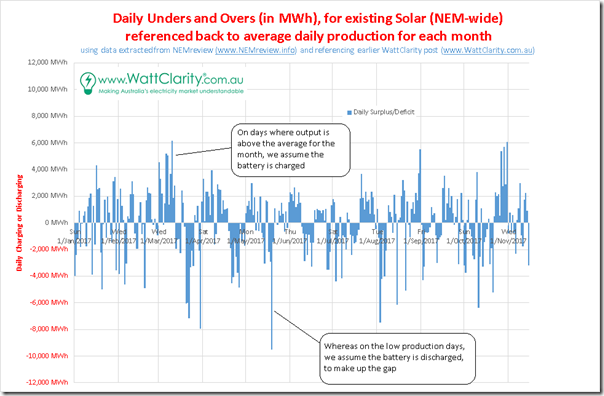
So I took the data above and calculated the “unders and overs” for each day when referenced back to the average for the month (this was the same chart as shown on the previous post, just with the numbers represented as volume (MWh) over the day, rather than average (MW) rate of charge/discharge):
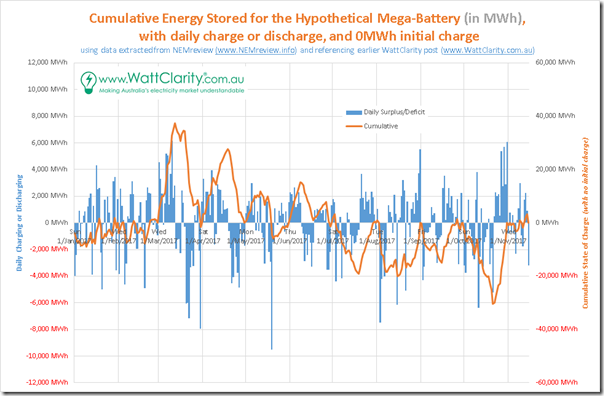
The next step is to add in a cumulative total across the year. Assuming a 0MWh charge amount at the start of 1st January reveals the orange trend line in the chart below (axis on the right):
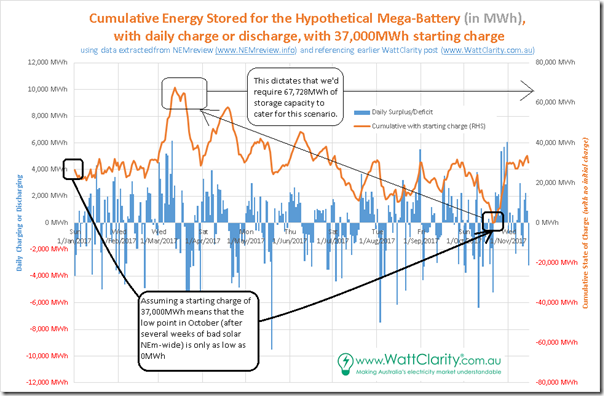
Now obviously a battery can’t have a negative volume of energy stored (we see it drops well below zero in October above), so we need to adjust the starting point to ensure that the stored energy across this 11 months drops no longer than 0MWh over the period. We do this by adding the lowest point in the chart above (37,410MWh) and assume this was already charged as at 1st January:
As noted on the image, based on all these assumptions (and there are a few) we’d need 67,728MWh of storage in place to provide the flexibility to (if required) levellise effective solar production for each day of a particular month – which might make the job easier of “that other thing” to deal with the seasonal variation on output.
Now my understanding is that we’re at something like 6,000MW of installed solar capacity installed by April 2017 – 5,600MW rooftop and 496MW large scale as noted by Giles in April (which works out an average capacity factor of only 13% from the output numbers shown in the first chart – which seems a little low… ). The same article on RenewEconomy talks of 1.67 million installations (meaning average size by installation of 3,590kW – so a little smaller than my 5kW array, whose size was dictated by the limit of the 44c/kWh FIT).
… so I re-read and find that WA and NT are include in Giles’ numbers and I take them off – bringing this back to 4,886MW of rooftop, and still close to 500MW of large solar (which brings the capacity factor up to 15% for 808MW average output across the 11 months in the NEM).
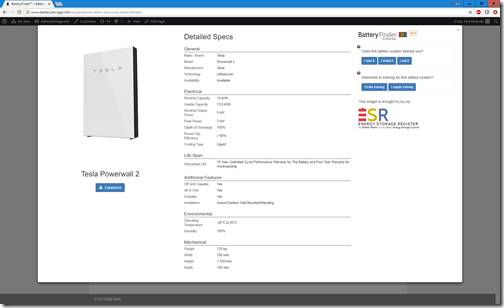
Over 1.5 million households (say, knocking a few off for WA and NT), the 67,728MWh of storage “required” equates to a 45kWh per solar installation. Referencing our useful Battery Finder Widget, we find that the Tesla Powerwall 2 has a nominal capacity of 14kWh:
I think this implies (if my calculations above are correct) that all of these 1.5 million households would need 3 x Tesla 2 batteries in order to be able to have the effect of evening out the day-to-day “unders and overs” in solar PV output around the monthly average NEM-wide. This makes me think that either:
Scenario #1) There is a big flaw in my numbers above (which is entirely plausible as this was done in a rush for a conversation starting shortly); or
Scenario #2) If no error, then it would be impractical to assume that this particular scenario could unfold….
[I do apologies for the scatty thinking in the above – I’ve run out of time on this today]


I fool around with numbers in the same way to get a handle on an issue. I contend there are two sorts of minds word-smiths and numerate minds. The world is mostly run now by and controlled now by the word-smiths because (1) there many of them who don’t have a worthwhile engagement in life and (2) their thoughts resonate with the pubic. But I can’t thing without numbers being a Professional Engineer and I believe no one else can who wants to make a worthwhile contribution to the current debate about electricity.
But to your topic. Most calculations suggest that cycling electricity in and out of a battery adds between 20 cents and 40 cents per kWh ($200 to $400 / MWh). Those figures assume the battery runs for its expected life at about 1 cycle per day. These costs need to be paid by someone and they are far from insignificant. Whatever the reasons are to have a battery these costs are real and to my mind dominate the other considerations.
Hi Paul,
a couple of observations that I think will make a big difference to your analysis.
1. Most 100% renewable studies accept that if you have a week of really good solar (and/or wind), then you will likely be better off spilling some of the excess rather than trying to store every last kWh. Spilling 10% of your annual resource during the good times will only add 10% to the LCOE of the wind or solar, which is not an outrageous imposition. If you redo your calcs assuming a 10% overbuild, and assume that 10% gets wasted during the good days, then I think you’ll find that storage gets reduced considerably.
2. Our existing hydro is quite flexible, sometimes it puts out less than 500 MW, sometimes it puts out more than 4,000 MW. If you run existing hydro on average 1 GW harder during a week of poor wind and solar weather than you do during a week of good weather, then that reduces your storage requirements by 168 GWh, ie an amount far greater than the 68 GWh of storage that you came up with.
Having said that, your assumption to ignore seasonal differences in generation was clearly very generous. Put that back in and storage requirements increase massively. The AEMO and UNSW 100% renewable studies found that the NEM would need around 100 to 200 GWh of storage, though they both had essentially full back-up from dispatchable gas generation (converted to biofuels) that would run during the periods of poor wind or solar.
The recent ANU (Blakers) and the older BZE 100% renewable studies didn’t rely so heavily on this dispatcable back-up, and as a result they required much more storage, 400 to 700 GWh.
I think its just an unfortunate truth.
The unknown aspect is how it would perform in real life depending on gross variations in how the stored energy is used.