It’s a bright sunny and warm August day in Brisbane, and we’re seeing my SMS alerts start pinging to mark a new lowest point for ‘Market Demand’ in the QLD region already this morning.
In this tabular summary of prior minimum demand points from 31st October 2021, the prior ‘recent times’ low point for the QLD region on this measure was 3,672MW at 11:10 on 3rd October 2021:
1) since ~2009, when demand began to decline;
2) under ‘ordinary’ conditions; and hence
3) not counting the extraordinarily low levels on 25th May 2021 in the aftermath of the Callide C4 Catastrophe.
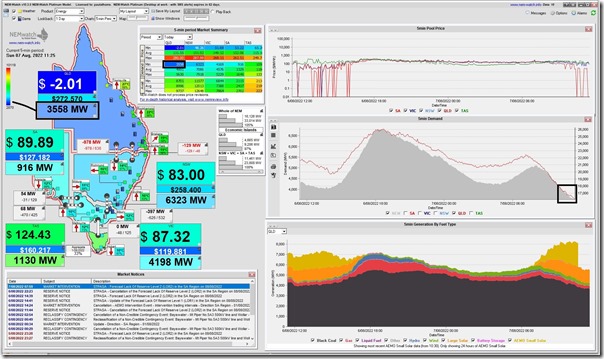
Here’s a snapshot from NEMwatch at 11:25 today showing the QLD ‘Market Demand’ down at 3,558MW – which is lowest thus far today:
… it seems likely that it will drop further through the middle of the day.
PS1 – lowest point in ‘Market Demand’ today
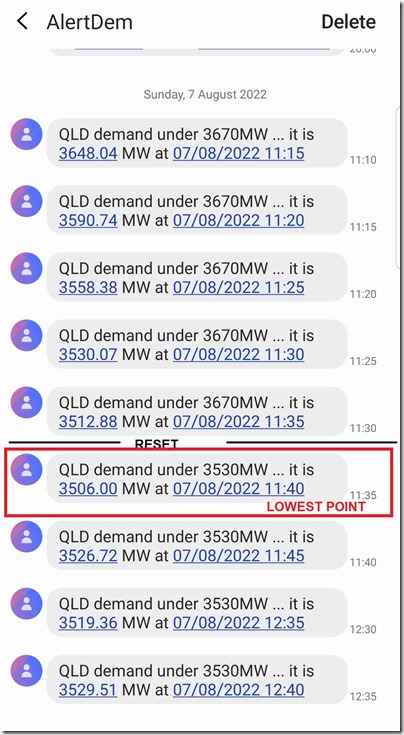
Useful to come back later with this snapshot of the SMS alerts received through the day:
As noted on the image, I reset the alert threshold around the time I posted the article this morning … and the level seen at 11:40 dispatch interval (down at 3,506MW) was the lowest point for ‘Market Demand’ in QLD today … and hence since ~2009 (excluding outage related).
PS2 – what about ‘Operational Demand’?
In recent years the AEMO and the TNSPs (like Powerlink) increasingly speak about ‘Operational Demand’, rather than ‘Market Demand’ – ‘Operational Demand’ might also be thought of as ‘Grid Demand’. So I wondered how low the demand point was by that measure.
Using the ‘Operational Demand’ data published by AEMO and reviewing in NEMreview v7 (not shown here) I see the lowest point was 3,672MW in the half-hour ending 13:00 – which (with reference to this this tabular summary) would have been lower than the previous low point at 3,784MW on Sunday 3rd October 2022.
…. but I assume AEMO will come along later to confirm this.
PS3 – a sizeable drop!
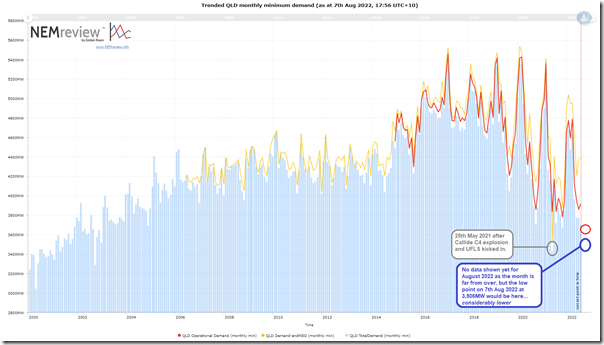
No matter which measure you use, that’s a sizeable drop in ‘minimum demand’ … over 150MW by ‘Market Demand’ and over 100MW by ‘Operational Demand’ … as we can see in this trended view of monthly low points for months up to and including July 2022 produced with NEMreview v7 here:
Those with a licence to the software can open their own copy of this query here.


Leave a comment