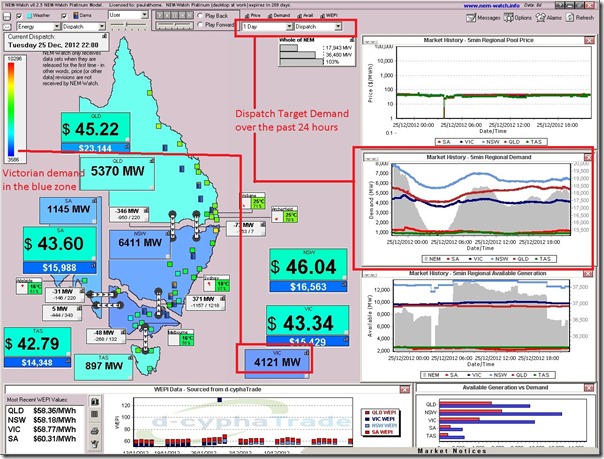
Tuned in tonight, briefly, and noted (see below) what seemed a remarkable demand curve for NEM-Wide demand across the NEM on Christmas Day, as seen in NEM-Watch:
See how demand peaked in the morning (around 10am NEM time) before falling away considerably over lunch time and returning somewhat later at night.
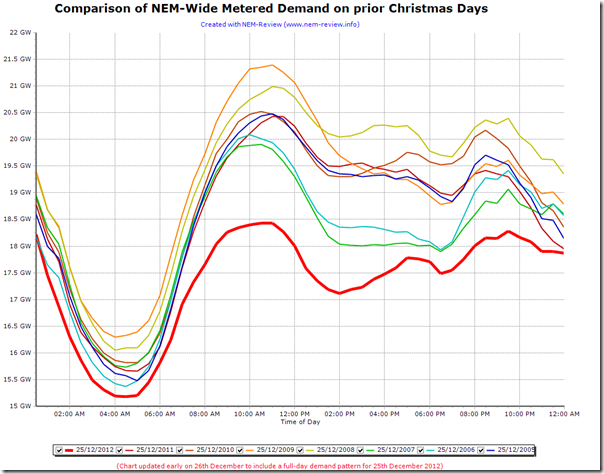
To compare how this year looked to a few recent prior years, we opened up NEM-Review briefly and generated this chart:
From this we see that the pattern is consistent (so not as remarkable as first thought) but that the low during the day (approximately 17,000MW) is about1,000MW lower than the previous low levels experienced in 2006 and 2007, and up to 2,500MW lower than that experienced only last year.
This would have something to do with the underlying level of declining demand, but it would also have to do with particular weather patterns on the day (a cooler day in many parts of the NEM) – and, perhaps, the fact that Christmas day was a Tuesday this year.
I’d be interested to hear, from you, what reasons you see contributing to this low level?
By the way, don’t forget to submit your entries in our 7th annual “Best Demand Forecaster in the NEM” competition before the New Year!


Be the first to comment on "A remarkable(?) Christmas Day load shape"