
1) Why we’ve put this together
For those who weren’t aware, summer 2008-09 has seen us relaunch our “Who’s the Best Demand Forecaster in the NEM” competition.
Of particular interest:
- This year we’ve also resurrected this 6-burner BBQ as a prize, and
- We excluded the “slackers” from entering the competition (by which we mean that entries were only accepted from people during the 2 weeks of Christmas and New Year – meaning that we only received entries from those who were soldiering on, whilst everyone else relaxed, and had a good time).
For those who are interested, you can check out our summary of the entries we received over that two week period.
2) Contents
1) Why we’ve put this together
2) Contents
3) What’s demand been like, in summer to date?
(a) Thursday 25th December (Christmas)
(b) Wednesday 31st December (NY Eve)
(c) Tuesday 13th January
(d) Thursday 15th January
(e) Wednesday 14th January (between)
3) What’s demand been like, in summer to date?
Given that the holidays are now over (for most of us) and we’re returning back to “normal” life, we thought it would be a good time to provide a brief overview of what’s happened in terms of NEM-Wide demand, to date.
The following chart (which we’ve prepared in NEM-Review) shows how the NEM-Wide demand has trended, on a trading-period basis, over the first 48 days of summer.
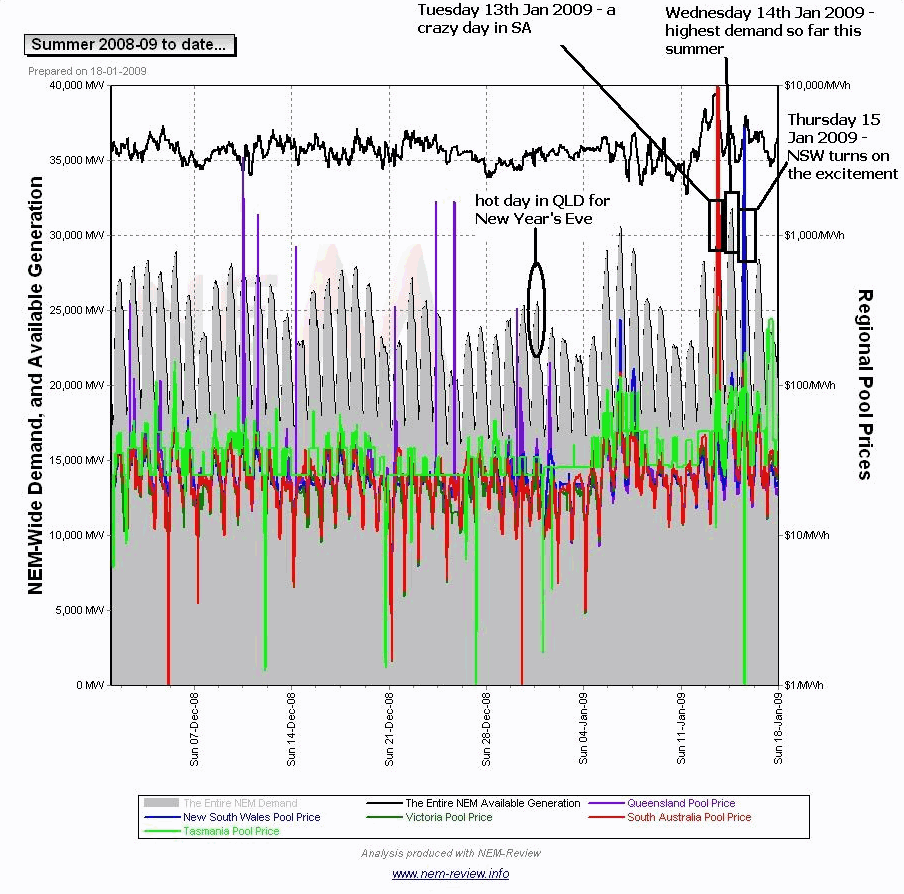
Note that this chart has been included for convenience of access to trading (30-minute) data. Our measurement of peak NEM-Wide demand is the peak dispatch (5-minute) demand target, which is being tracked separately.
Of particular interest, we have marked in the above chart the following occasions:
(a) Thursday 25th December (Christmas)
We can see in this chart that the demand on Christmas Day did not rise above 21,000MW across the day.
(b) Wednesday 31st December (NY Eve)
We’ve previously written about how New Years Eve was a very hot day in QLD.
We can see from the chart above that, even though QLD demand rose above 8000MW (and not far off its historical maximum) the NEM-wide demand was fairly unremarkable on the day.
(c) Tuesday 13th January
We’ve also previously written about the scorcher of the day experienced in SA, and parts of VIC, on 13 January.
We can see from the chart above that the NEM-wide demand experienced on the day was amongst the highest demand levels experienced over summer (to date) – but still well below the consensus forecast of around 32,500MW which our entrants have provided.
(d) Thursday 15th January
Finally, we have also written about the high temperatures experienced in and around Sydney on 15 January.
Our other article notes how a new summer peak demand for NSW was set on this day.
(e) Wednesday 14th January (between)
In between these two days of high local temperatures, and localised demand, we actually see (in the chart above) that the highest NEM-wide demand experienced in the NEM to date occurred on Wednesday 14th January.
Further analysis conduced with the dispatch data updated by NEM-Watch reveals that the peak NEM-wide demand experienced on that day (and hence summer-to-date) was 31,814MW experienced at 15:50 on Wednesday.
We’ve looked to see if we have a NEM-Watch screenshot of this event, but do not – hence we have included here a snapshot taken just 35 minutes afterwards (16:25), when NEM-wide demand had dropped slightly:
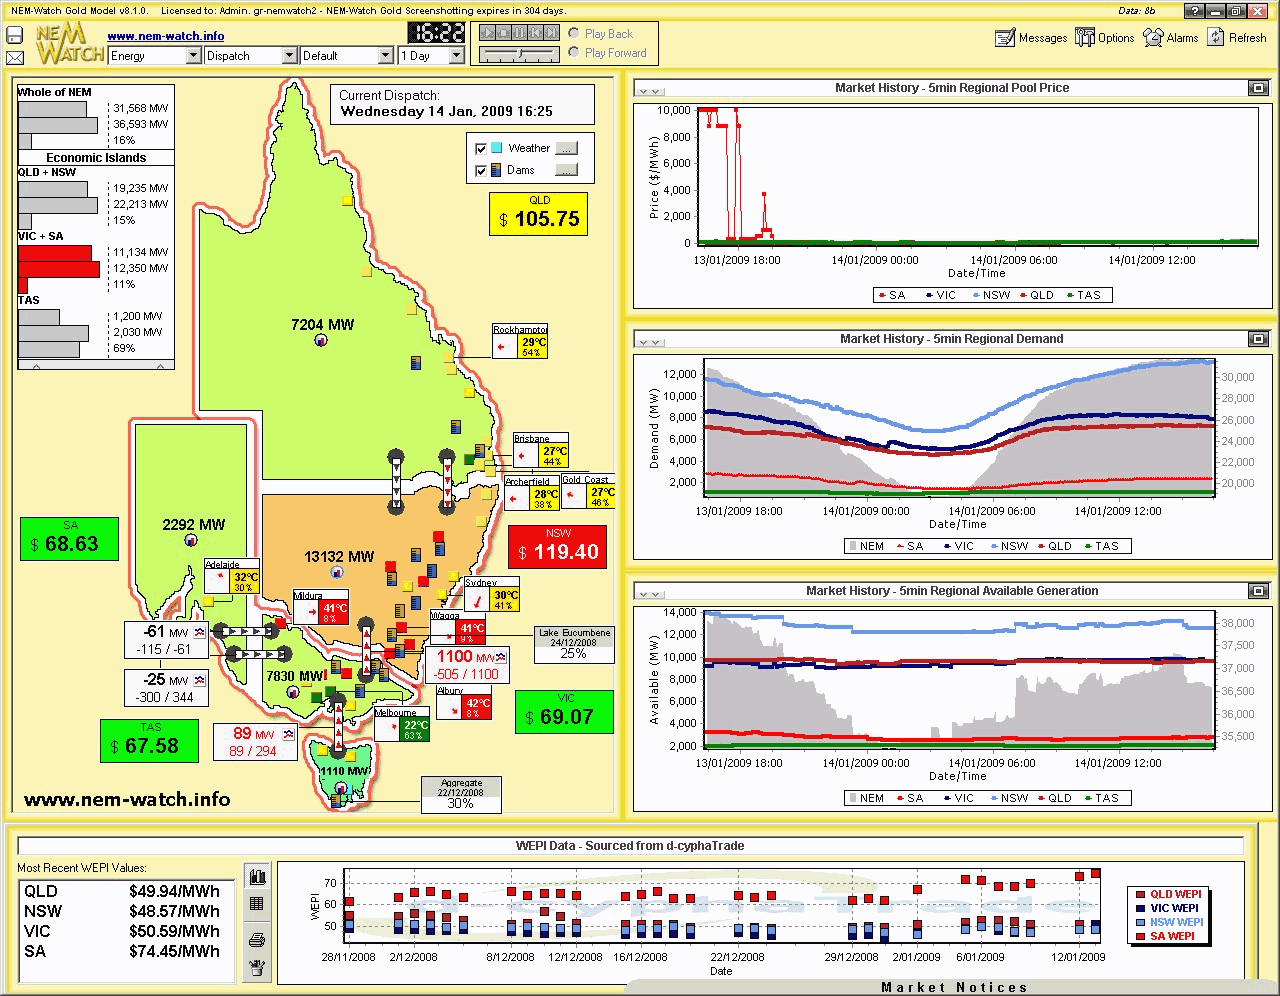
In this image, we can see:
- By the region’s colouring, that NSW demand was relatively higher, compared to each region’s historical range. This is not a significant surprise, given the higher temperatures seen in central NSW.
- We can also see prices were moderate across the NEM (especially in comparison to the previous day);
- This is especially noteworthy, given that the Instantaneous Reserve Plant Margin (IRPM) of the VIC+SA Economic Island is shown to have been around 11% at that time.
Be the first to comment on "Summer 2008-09 to date"