
Whew! What a day it was yesterday.
As reported in various media:
The Age,
The Australian,
The Sydney Morning Herald,
news.com.au, and
The Courier Mail
Victoria experienced a large blackout in the afternoon and into the evening as a result of multiple transmission lines due to bush fires in close proximity.
However that is by no means the full story of what happened – yesterday saw a new all-time maximum demand set right across the NEM (and also in Victoria, with South Australian being not far off as well), we saw 2600MW of load lost as a result of the transmission event, regions islanded and a full range of prices ranging from -$1,000/MWh to $10,000/MWh.
As the afternoon progressed, we found it increasingly difficult to concentrate on anything other than the unfolding story as seen through the NEM-WatchTM display. As a result, we thought you might appreciate the following record of what happened over the course of the afternoon.
Please note that:
1) This summary has been put together before NEMMCO has released the confidential generation data for yesterday, so the story provided below has been put together just with reference to NEM-Watch. We were not able to complete similar analysis to what we have completed for Thursday 11th January 2007, where we looked at generator bidding behaviour, and hence contribution to the price spikes that occurred on that day.
2) All times referenced are in Market Time, which is Australian Eastern Standard Time (no daylight savings).
|
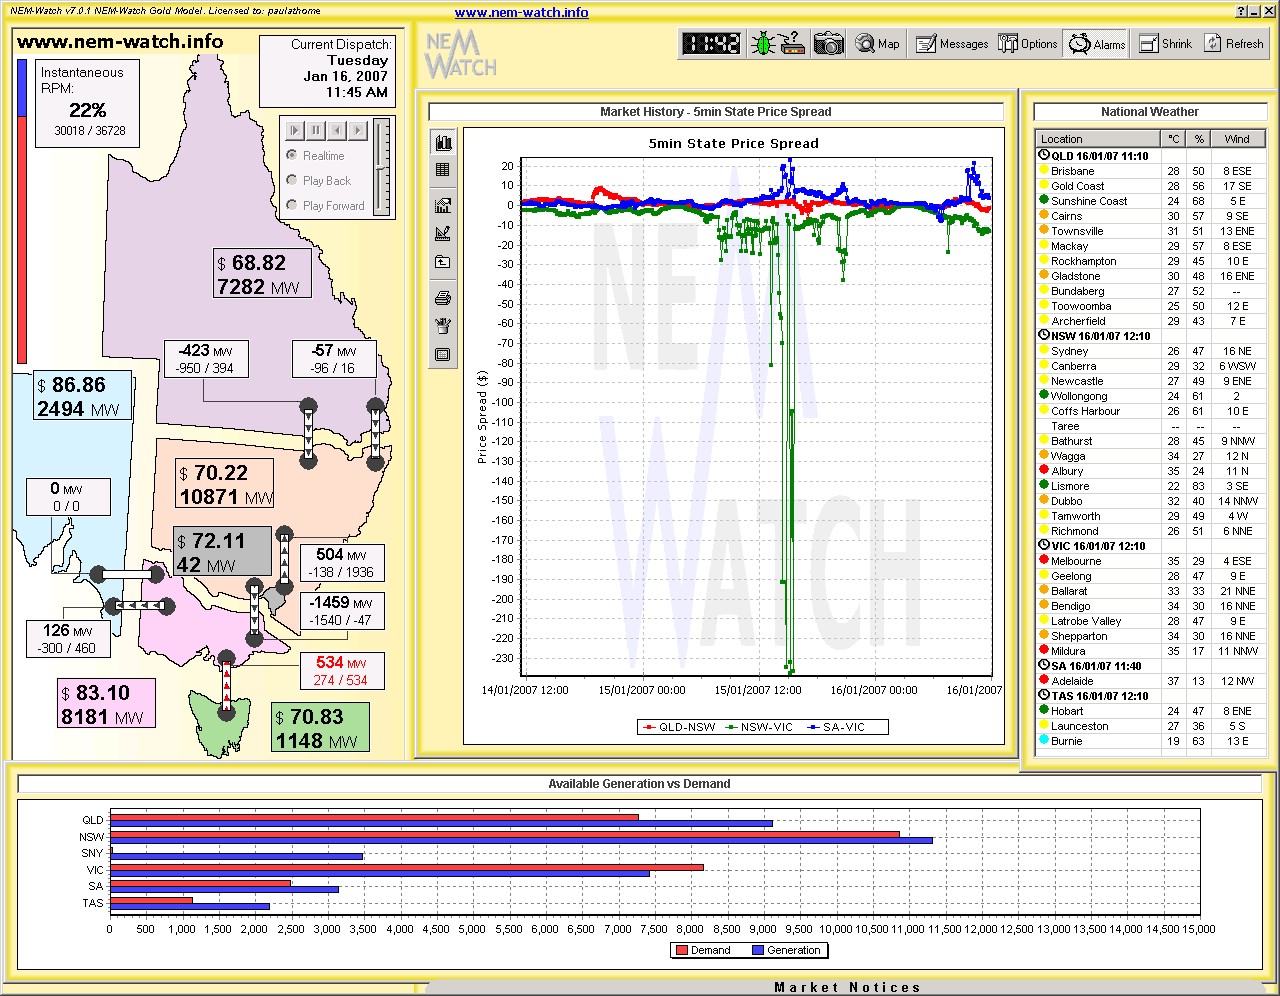
11:45 |
At 11:45, the day was just like several other days that had occurred recently this summer, with prices only slightly elevated and a very healthy reserve plant margin of 22% right across the NEM. However, in an ominous sign we see that NEM-wide demand had already crept about 30,000MW (for only the second time this summer) and temperatures in both Adelaide and Melbourne had reached 35 degrees. Note that the chart in the NEM-Watch display in this image reflected a divergence between NSW and VIC prices on the previous day. |
Click on the image for a closer view |
|
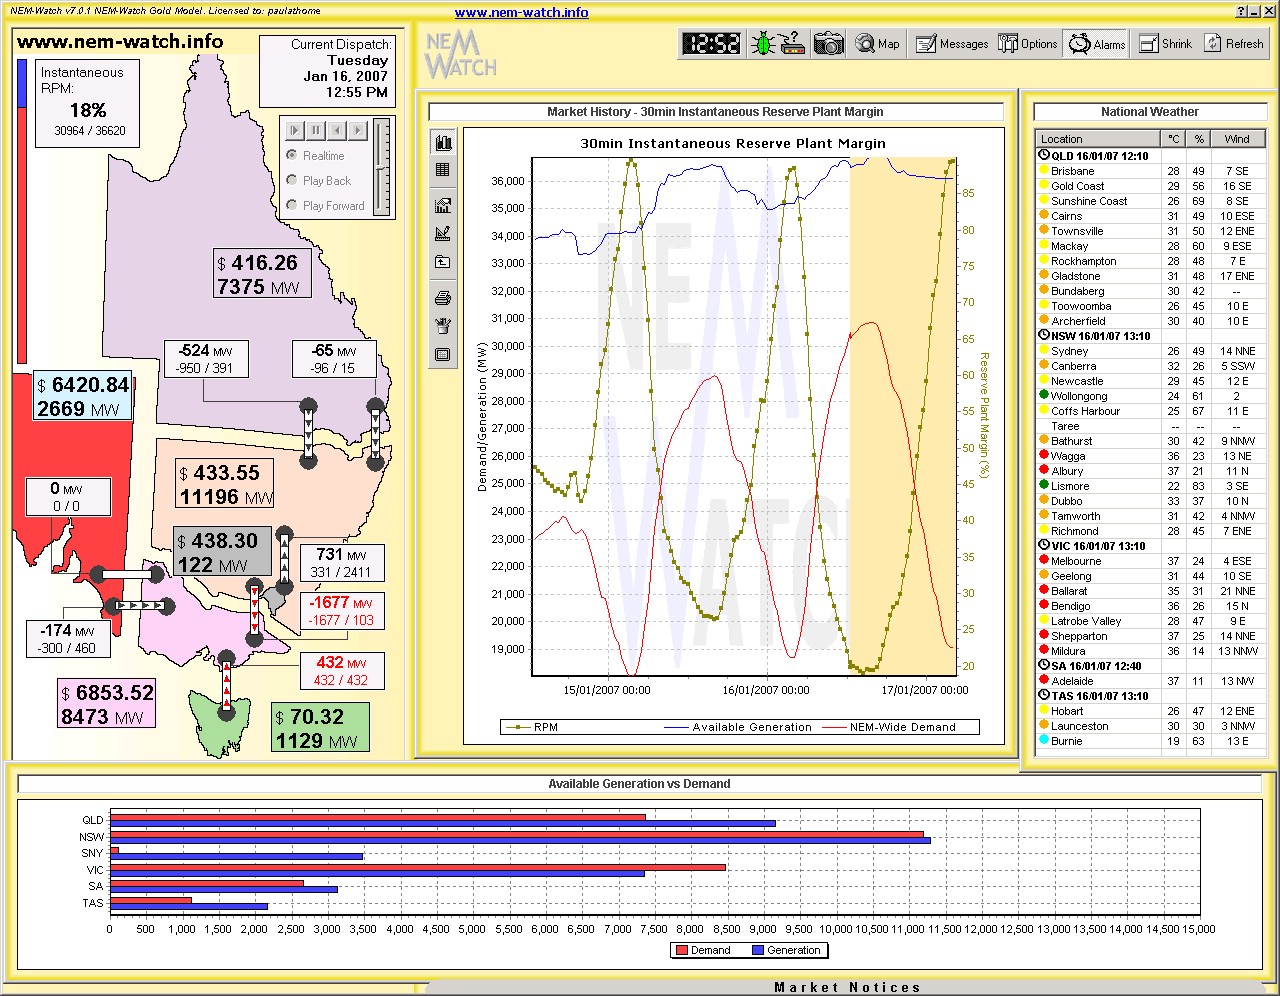
12:55 |
An hour later, we see that the NEM-wide demand had climbed to 30,964MW (which almost matched last summer’s maximum demand of 30,994MW – despite the fact that some industry is still on holidays this week). As seen in the NEM-Watch image, prices in Victoria and South Australia were already well in excess of $5,000/MWh, temperatures had reached 37 degrees in Melbourne and Adelaide, and the reserve plant margin had dropped to 18% (on a NEM-wide basis). At this stage it can also be seen that NEMMCO was forecasting the NEM-wide demand to peak around 31,000MW later in the day (on a trading interval basis). Given that the 5-minute demand target was already just below this, it appears that demand was accelerating at a rate faster than forecast for the day. |
Click on the image for a closer view |
|
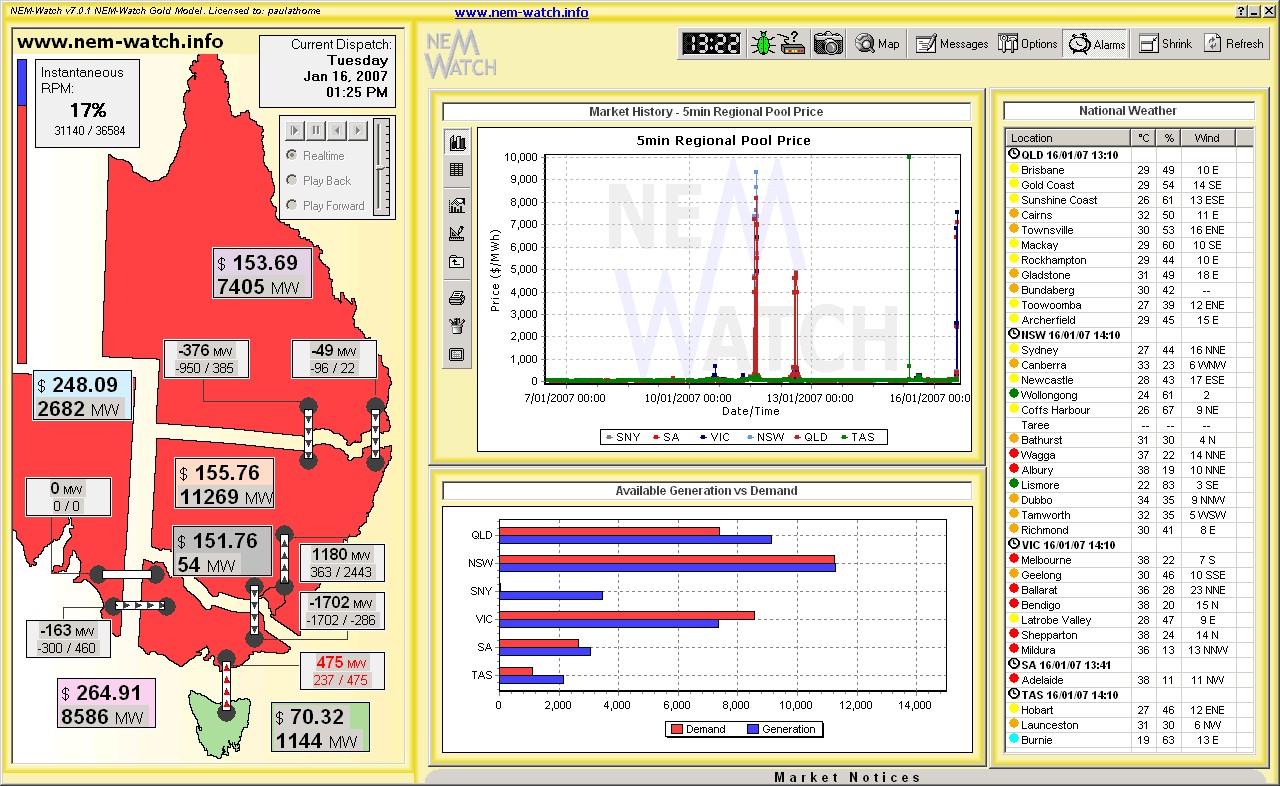
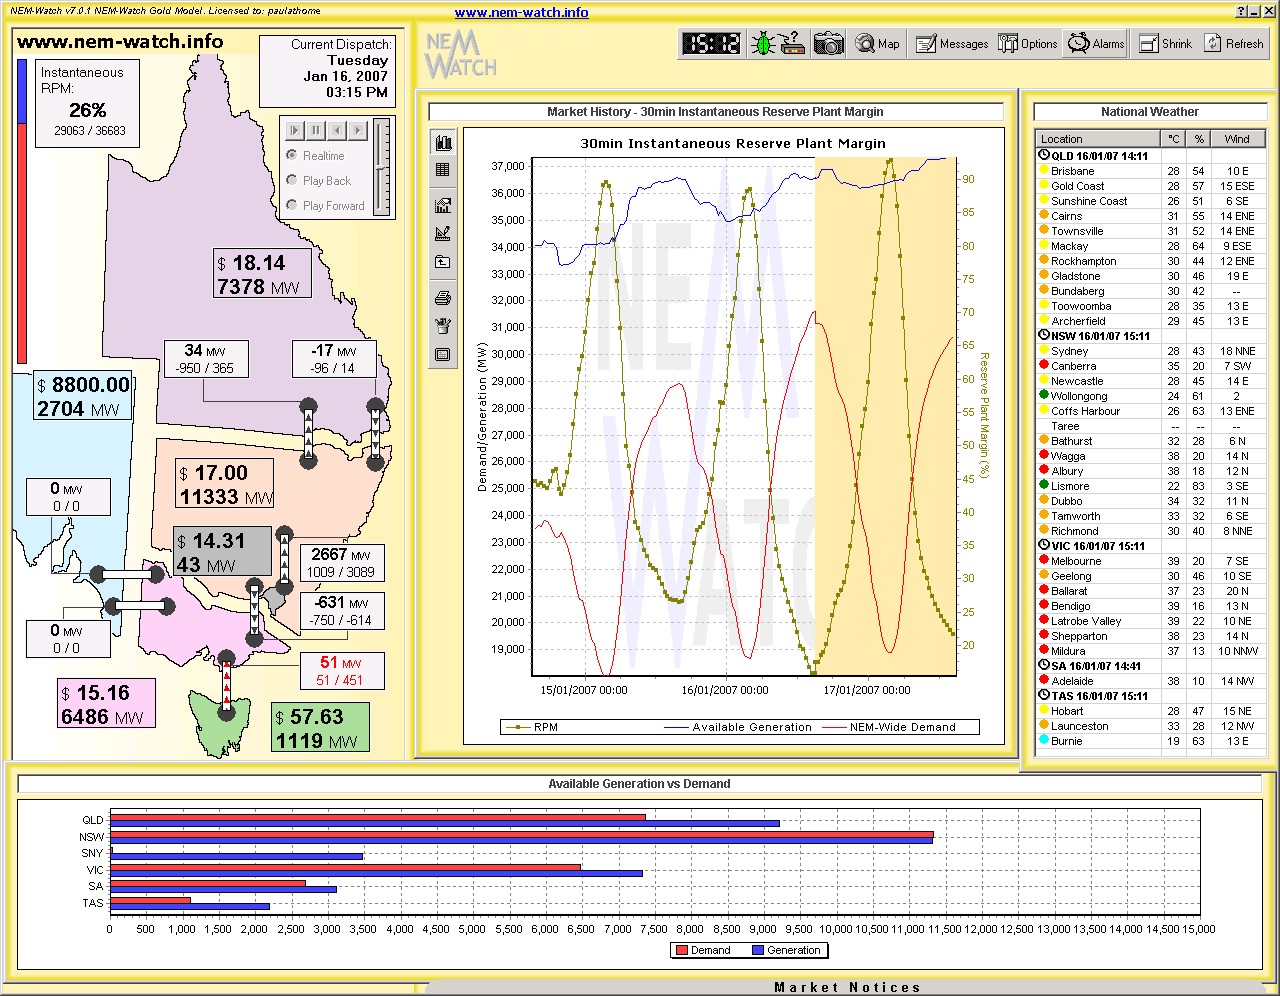
13:25 |
A mere 30 minutes later, and we see that demand had increased still further to 31,140MW, and the NEM-wide Instantaneous Reserve Plant Margin had dropped to 17%.
Prices had dropped in Victoria and South Australia, but temperatures had nudged up another degree over the period. |
Click on the image for a closer view |
|
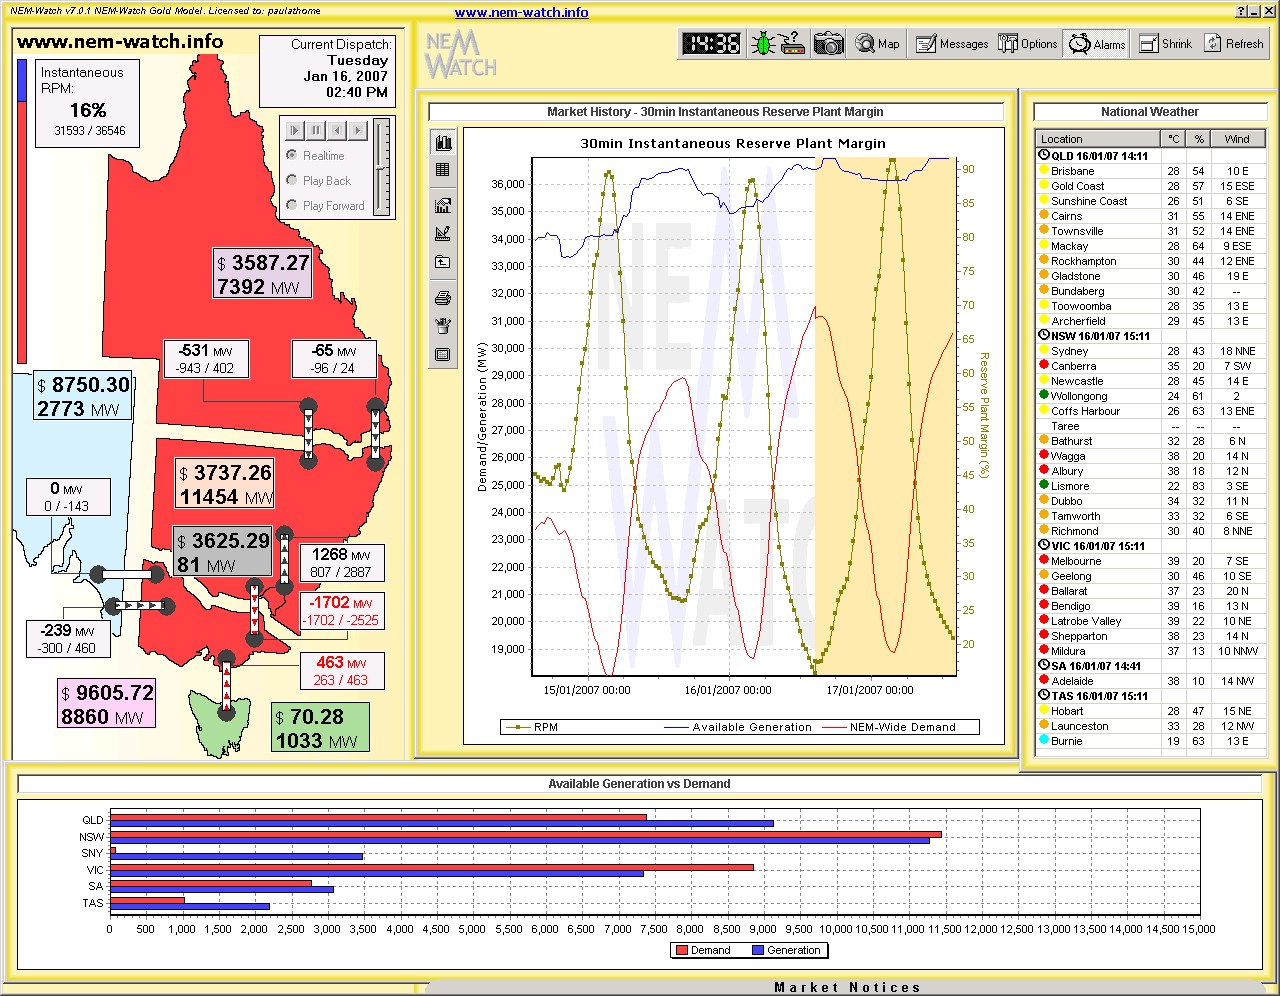
14:40 |
An hour and 15 minutes later, we see that the demand had continued to grow (to be 31,593MW, As can be seen in the NEM-Watch display, huge prices were being experienced in all mainland A quick calculation we have done just now reveals that the effective reserve plant margin for the |
Click on the image for a closer view |
|
15:02 |
NEMMCO reports in its Market Notice #15840 that:
A later Market Notice confirmed that the lines out of service were:
|
|
|
15:15 |
10 minutes after the tripping of the transmission lines and we see a clear picture of the way it has impacted on the market: 1) The Heywood interconnector has tripped, and as a result South Australia is islanded from the rest of the NEM. Prices in South Australia are very high as a result. 2) Prices have dropped significantly in other regions, which are now awash with surplus capacity. 3) Because of the drop in demand, Reserve Plant Margin across the NEM jumps to 26%. |
Click on the image for a closer view |
|
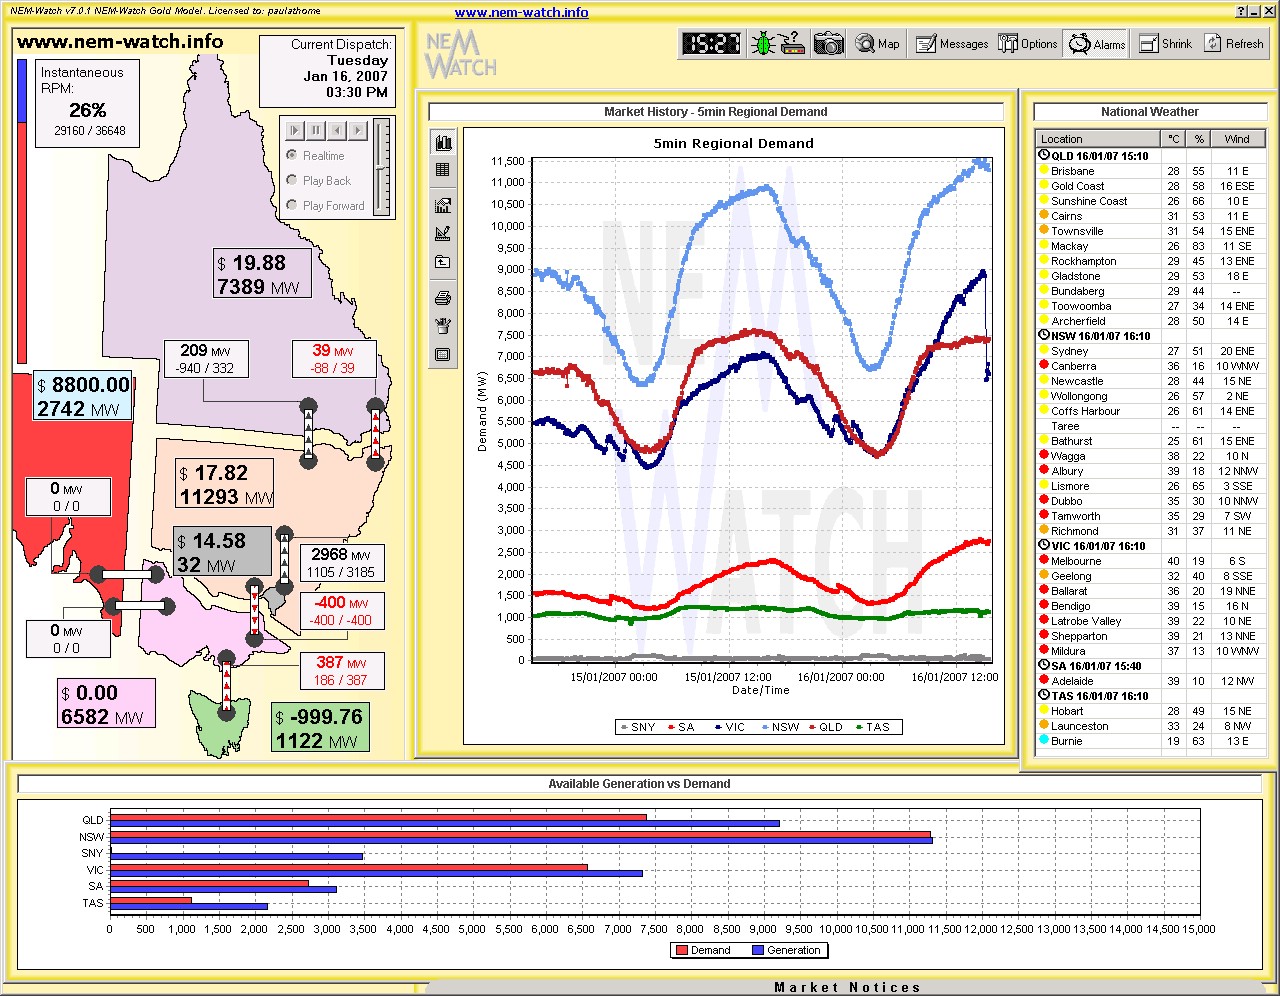
15:30 |
In this snapshot, we see: (a) A massive (2,600MW) loss of load in Victoria, from a peak of almost 9,000MW (which was a new all-time maximum demand for the region). (b) Prices ranging from $8000+ in South Australia, to $0 in Victoria and down to almost -$1,000/MWh in Tasmania.
|
Click on the image for a closer view |
|
15:42 |
NEMMCO reports in its Market Notice #15841 that the South Australia and Victorian regions were re-synchronised at 15:42. However, NEMMCO advised that the VIC-SA-TAS region island remained separated from the Snowy-NSW-QLD region island and Separation constraints remained in place. |
|
|
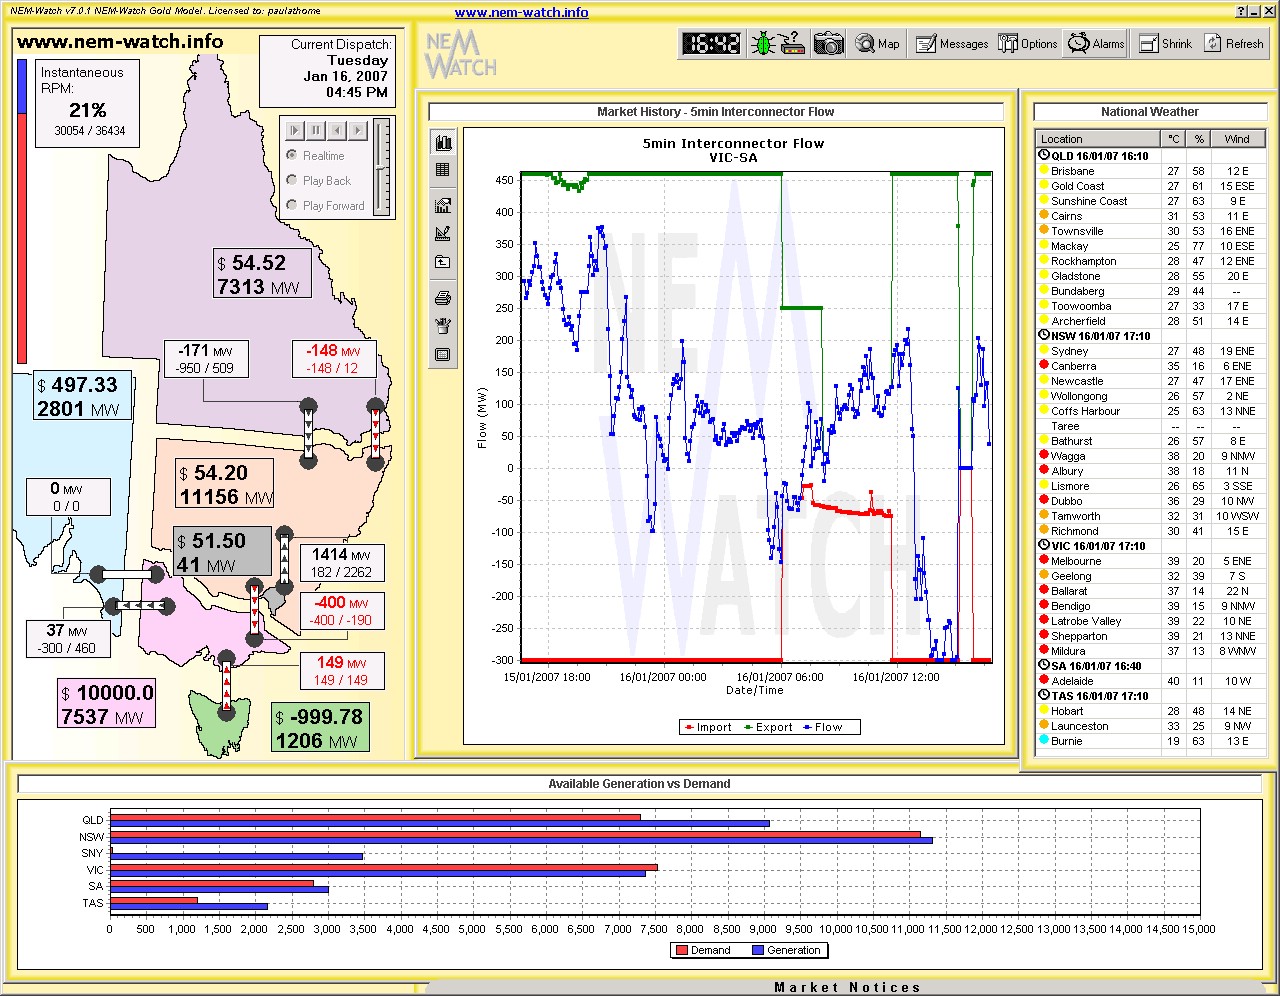
16:45 |
In this snapshot, we see: 1) Heywood back up and running again, in this case transferring power from Victoria into South Australia (against the price differential – though note that NEMMCO had a VOLL override in place between 16:20 and 18:20. 2) A VOLL price in Victoria, and another instance of price at -$1,000/MWh in Tasmania. 3) Note also that reserve plant margin had dropped to 21% (with load above 30,000MW again) as more load was brought back on-line. |
Click on the image for a closer view |
|
17:58 |
NEMMCO reports in its Market Notice #15886 that SA-VIC-TAS and SNO-NSW-QLD regions have been re-synchronised at 17:58. |
|
|
18:15 |
NEMMCO reports in its Market Notice #15885 that all load had been restored in Victoria at 18:15. |
|
|
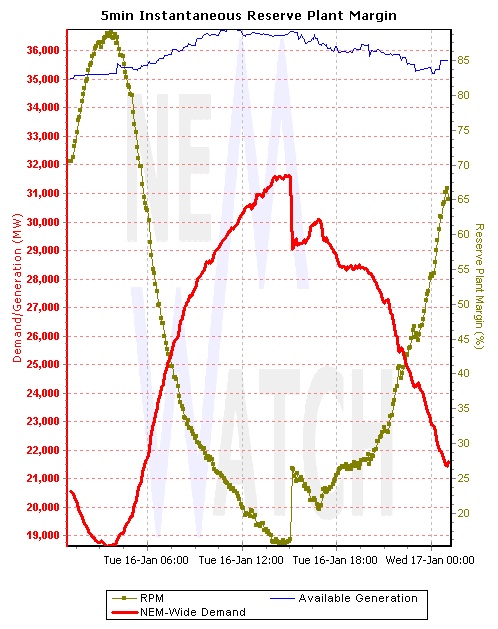
END OF DAY |
In the chart we have included here, we can see clearly the impact that the outage had on the whole of NEM demand. |
Click on the image for a closer view |
Leave a comment